Candlestick Charts 101: A Comprehensive Guide for Beginners
2023-03-14 01:24:35What is a Candlestick Chart?
Candlestick charts, which originated in Japan, were initially used in the Osaka commodities market during the mid-1800s. In the 1980s, they were introduced to western countries and have since become a widely used technical analysis tool in the cryptocurrency, stock, and futures markets. The shape, size, and color of each candlestick on the chart provide useful market information, enabling traders to analyze market trends and potential turning points, thereby allowing them to develop more effective trading strategies.
How Do Candlestick Charts Work?
A candlestick chart is a technical analysis tool utilized to depict price movements. It is comprised of a sequence of vertically arranged rectangles and wicks, where each bar symbolizes a price trend during a specific time frame. The upper and lower boundaries of the body indicate the maximum and minimum prices throughout the period respectively. Meanwhile, the body represents the opening and closing prices.
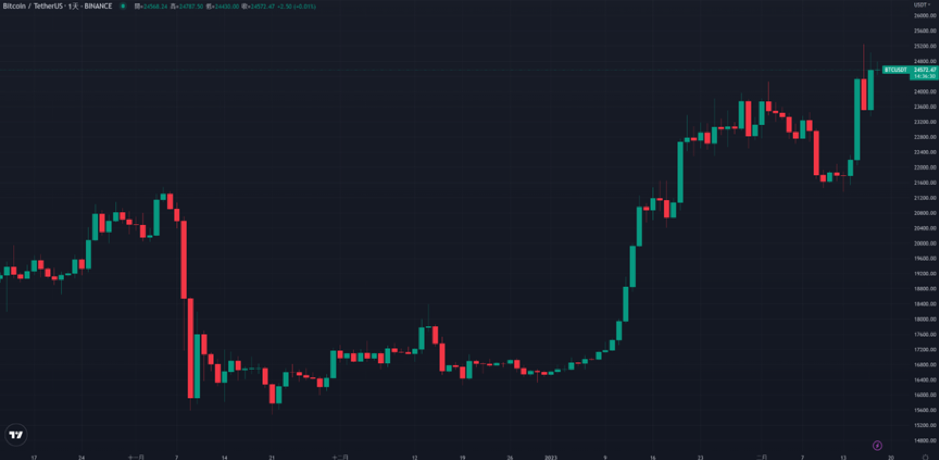
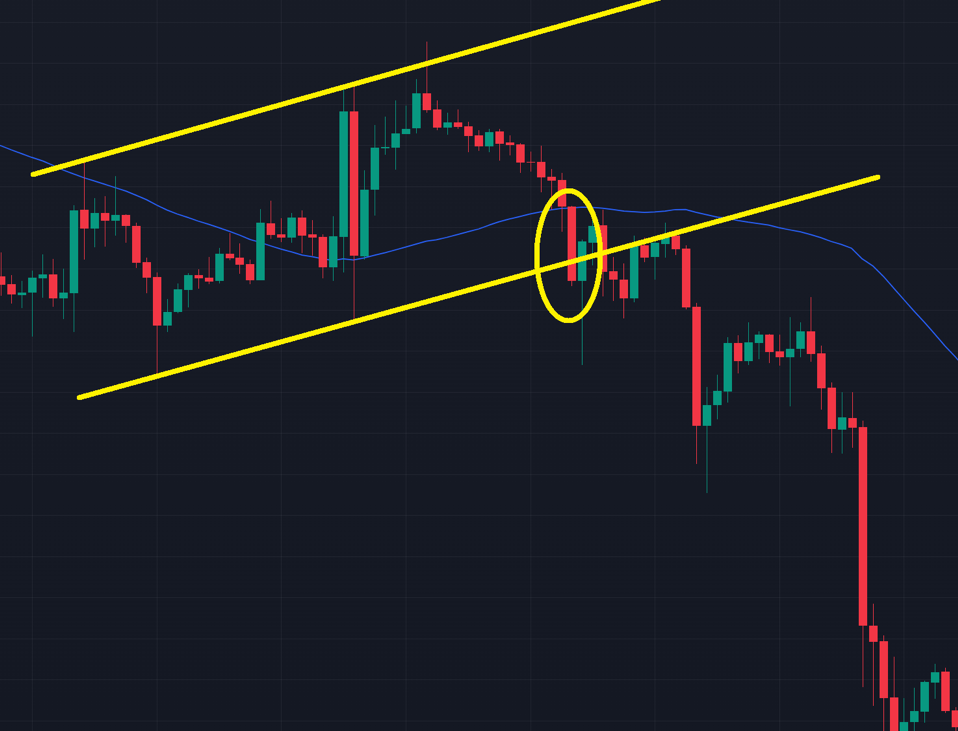
This chart above depicts the candlestick chart for BTC/USDT, which encompasses the following information.
- 1. Cycle
- 2. Candle Color
- 3. Candlestick body
- 4. Candlestick wick
- 5. Candlestick pattern
How to Identify and Use the Cycles in Candlestick Chart Analysis?
The candlestick chart can represent various time periods such as daily, weekly, monthly, hourly, and minute intervals. The cycle reflects the time duration presented by each chart body. For instance, a one-day period displays one chart body representing the market trend of a day, while a one-week period depicts one chart body illustrating the market trend of a week. Similarly, a 30-minute period displays one chart body that reflects the market trend of 30 minutes, and so on.
The candlestick chart of different time intervals can demonstrate the market trend and the performance of trading strategies in different periods. In the cryptocurrency market, the most frequently used time periods are the 1-day, 4-hour, and 30-minute Candlestick charts, which indicate the long-term, medium-term, and short-term trends.
Different Colored bars in Candlestick Charts
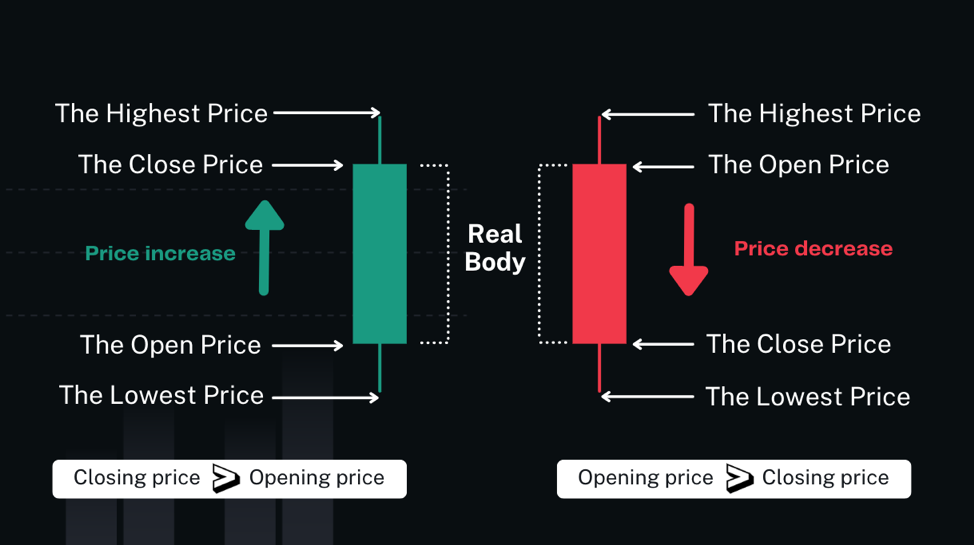
A candlestick chart is a visual representation that depicts the price movement of a security or cryptocurrency. It comprises a series of bars, called candles, which vary in height and color. The color of each candle illustrates the price action for a specific day. In the cryptocurrency market, a green candle depicts a higher closing price than the opening price, signaling a price increase, while a red candle depicts a lower closing price than the opening price, signaling a price decrease.
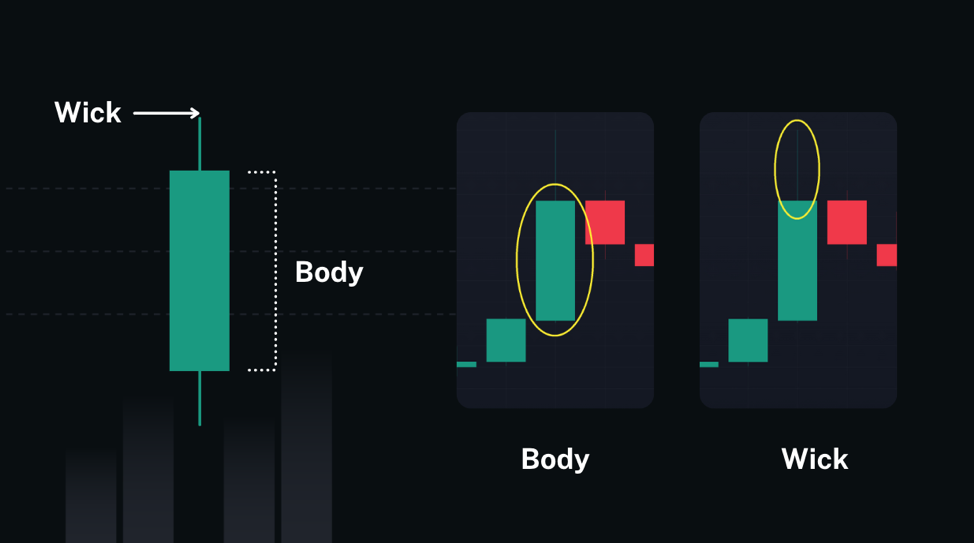
Candlestick Body and Wick
A candlestick consists of two main parts: the body and the wick. The body represents the price movement between the opening and closing prices, while the wick reflects the extent of fluctuations throughout the day. Specifically, the upper wick shows the highest price reached during the candlestick period, and the lower wick indicates the lowest price. The length of the body corresponds to the level of market volatility, with a longer body suggesting greater volatility, and a shorter body suggesting lower volatility. Candlestick signals can be used by traders to analyze various periods of trading, ranging from daily or hourly cycles to even minute-long cycles during the trading day.
How to Read Candlestick Charts: Essential Tips for Successful Trading?
Candlestick charts are a prevalent tool used in technical analysis, and it is important to take note of the following points when using them:
1. Select the Time Intervals
One of the first steps in reading a candlestick chart is to select the time cycle. Candlestick charts display different time intervals, such as one day, one hour, or 15 minutes. It's essential to consider the appropriate candlestick period for the technical indicators used and choose the period that aligns with your trading style. Generally, for short-term trading in the cryptocurrency market, it's recommended to refer to the one-hour to one-minute candlestick chart. For medium-term trading, it's suggested to refer to the eight-hour to one-hour candlestick chart. For long-term trading, observing a candlestick chart of more than eight hours can be helpful. It's important to note that each period's candlestick chart will display different information content and density, which is essential to consider when analyzing the chart.
2. Analyze the Candlesticks for Market Trend
When reading a candlestick chart, pay attention to the color of each candlestick. A green candlestick signifies an upward trend, while a red one indicates a downward trend. By observing the recent candlesticks, you can get a sense of the market's momentum. If the recent candlesticks are mostly green, it suggests an increased likelihood of the market continuing to rise. Conversely, if the recent candlesticks are mostly red, it suggests a higher probability of a downward trend. Keep in mind that other factors, such as the length and shape of the candlesticks, can provide further insights into market trends and sentiment.
In addition to color, the body of a candlestick and its wick can indicate the market's sentiment. If the body part is larger than the wick, it suggests a more stable market sentiment, with stronger upward or downward forces. On the other hand, if the wick takes up most of the candlestick, it suggests an intense battle between buyers and sellers and a more unstable market sentiment. It's important to take into account both the color and composition of the candlesticks when analyzing the price trend and market sentiment.
3. Pay attention to Volume
Volume is an important indicator of market activity that can provide valuable insights into market sentiment. When trading volume increases, it often signals growing market interest and a potentially stronger trend. However, decreasing volume may indicate a weakening trend or waning interest in the asset. In general, volume tends to increase during upward trends, and when the price rises alongside increasing volume, it suggests a strengthening bullish sentiment. Conversely, during a downtrend, volume may gradually decrease, reflecting a cooling market sentiment. By monitoring trading volume alongside the candlestick patterns, you can gain a more comprehensive understanding of the market's behavior and make more informed trading decisions.
4. Combine Candlestick Charts with Technical Analysis Indicators
Candlestick charts are frequently utilized together with various technical analysis indicators like moving averages, RSI, MACD, and so on. These indicators aid traders in further analyzing market trends and turning points, as well as developing trading strategies. For instance, if a candlestick chart shows a distinct upward trend over a period of time and the closing price falls below its 20-day or 50-day moving average, this is typically interpreted as a market about to enter a downtrend. It is worth noting that technical analysis indicators should be used in conjunction with other market analysis techniques to increase their effectiveness.
5. Other Advanced Candlestick Chart Analysis
Apart from the aforementioned approaches, candlestick chart analysis includes various advanced techniques such as trend analysis, pattern analysis, and support and resistance analysis. Pattern analysis involves examining different price patterns on the candlestick chart to determine the market trend. For instance, when a "acending triangle" pattern appears on a candlestick chart, it typically indicates an upward trend in the cryptocurrency market. On the other hand, when there is a "double top" pattern on the chart, it generally suggests that the cryptocurrency market is on the verge of reversing and entering a downtrend. These advanced techniques can provide traders with valuable insights to make informed trading decisions.
Common Candlestick Patterns
To assist with the analysis of the cryptocurrency market, candlestick patterns provide a visual representation of price movements over time. By utilizing candlestick charts alongside other technical analysis tools, traders can gain valuable insights into market trends and make informed trading decisions. It's important to note that candlestick patterns require some knowledge and understanding of their components, so it's recommended to spend time learning how to read them before using them for trading purposes.
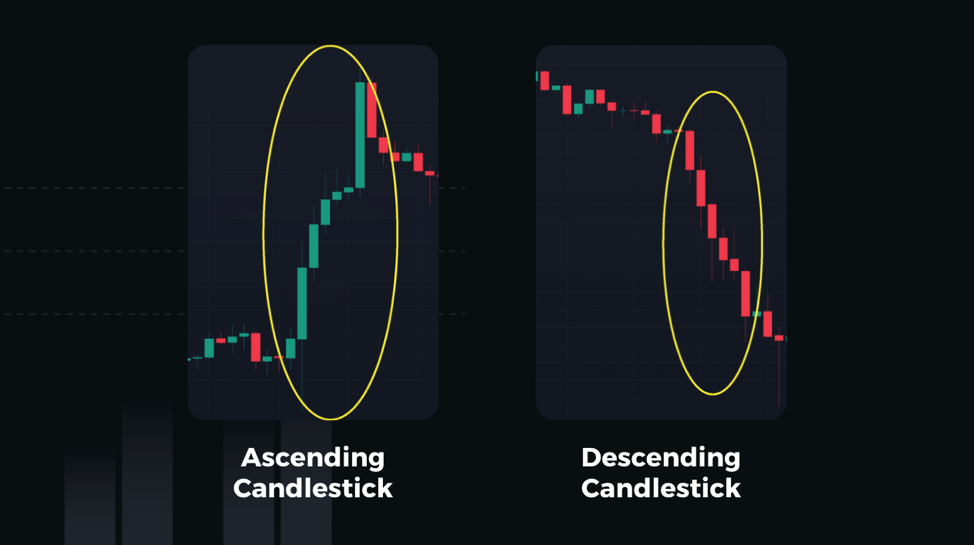
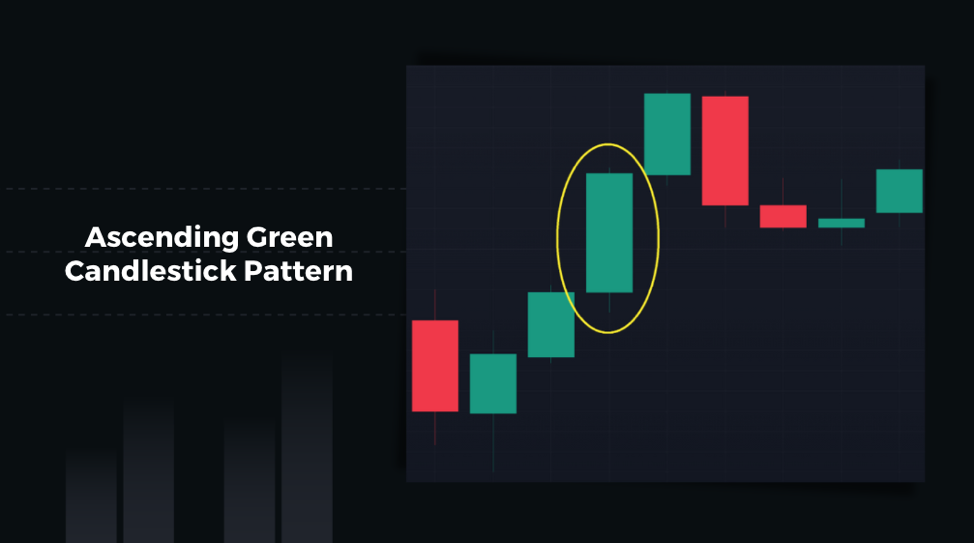
Ascending Green Candlestick Pattern
An ascending green candlestick pattern occurs when a series of candlesticks show progressively higher lows and roughly equal highs, indicating a bullish reversal. The pattern is identified by at least three candlesticks, starting with a bearish red candlestick, followed by one or more small bullish candlesticks that do not fully negate the previous bearish candle, and ending with a larger bullish candlestick that breaks above the previous high. This pattern reflects an upward trend in the market and suggests that buying pressure has surpassed selling pressure, which can be interpreted as a potential buying opportunity for traders.
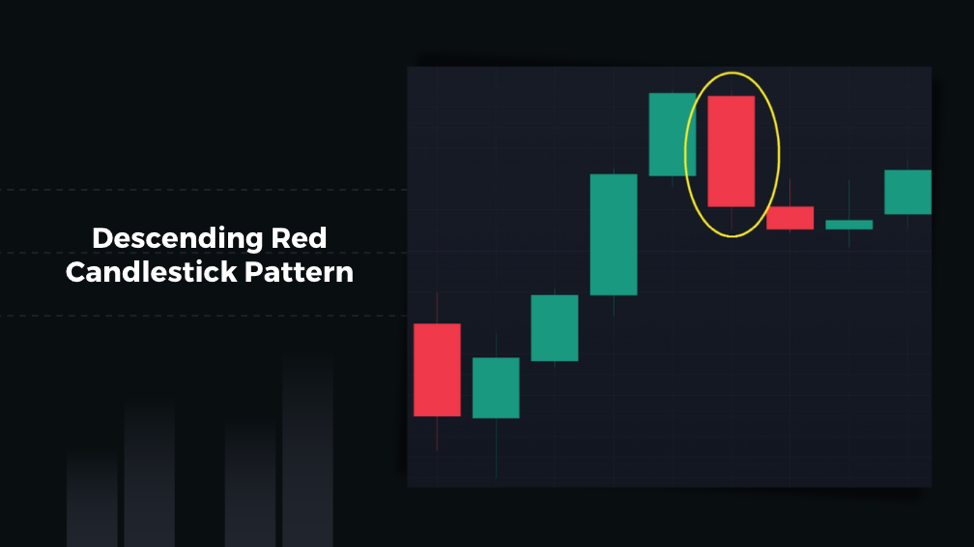
Descending Red Candlestick Pattern
The Descending Red Candlestick Pattern is a bearish price chart pattern that typically forms after an uptrend. It is identified by a series of candlesticks with progressively lower highs and roughly equal lows. The pattern consists of at least three candlesticks, starting with a bullish (green) candlestick, followed by one or more small bearish (red) candlesticks that do not fully negate the previous bullish candle, and ending with a larger bearish candlestick that breaks below the previous low. The descending red candlestick pattern indicates a shift in momentum from bullish to bearish, reflecting that selling pressure has exceeded buying pressure. This pattern is often used by traders as a signal to enter a short position.
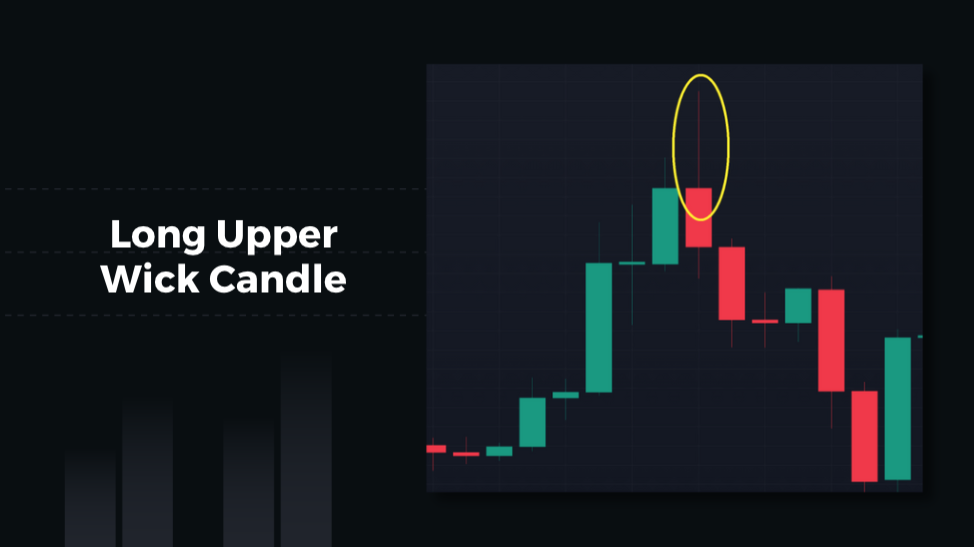
Long Upper Wick Candle
An upper wick candle, also known as a shooting star or bearish candlestick, is a type of candlestick chart pattern used in technical analysis. It is formed when the price of an asset moves significantly higher during a trading session, but then falls back down to close near the opening price. The upper wick of the candle represents the highest price reached during the session, while the body of the candle represents the difference between the opening and closing prices.
The length of the upper wick is crucial in understanding the upper wick candle, as it can provide insights into market sentiment and potential price movements. If the upper wick is very long, it typically indicates that sellers have taken control of the market and pushed the price down from its high point. This can be a bearish signal for traders, suggesting that the asset is encountering strong resistance and may experience further selling pressure. As such, traders often use upper wick candles as part of their technical analysis to inform their trading decisions.
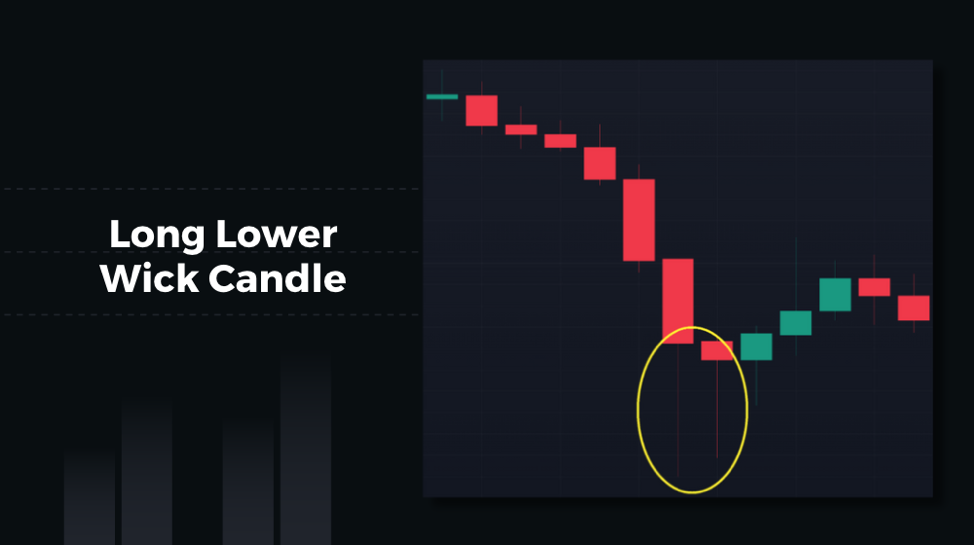
Long Lower Wick Candle
A Long Lower Wick Candle is another type of candlestick chart pattern conversely to the long upper wick one. It appears as a candlestick with a small or nonexistent upper wick and a long lower wick, where the body of the candlestick can be either bullish or bearish.
The lower wick, also known as the lower shadow, of the Long Lower Wick Candle represents the lowest price that the asset traded during the period. If the lower wick of the candlestick is significantly long, it suggests that the price was pushed down substantially but buyers were able to regain control and push it back up towards the end of the period. This indicates strong buying pressure at the bottom of the trading range and may suggest a potential trend reversal towards an upward direction. Traders often interpret a Long Lower Wick Candle as a bullish signal, particularly when it appears at the bottom of a downtrend.
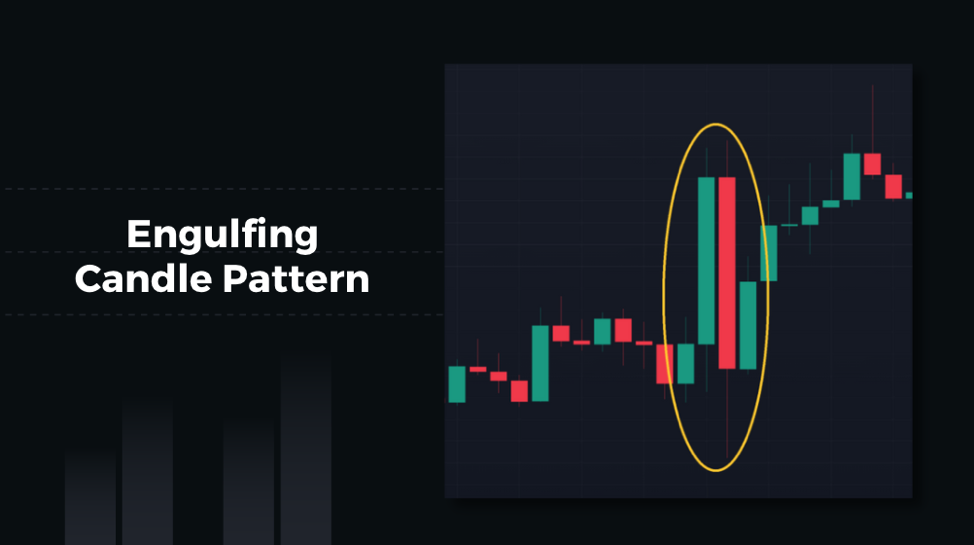
Engulfing Candle Pattern
An engulfing candle is a type of candlestick pattern that can provide traders with an indication of potential trend reversals. This pattern occurs when a candle with a solid body completely engulfs the body of the previous candlestick, resulting in a larger candlestick.
A bullish engulfing candle forms when a green candlestick with a larger body completely engulfs the body of a smaller bearish red candlestick. This is often interpreted as a signal that the market is entering an uptrend, as the bullish momentum has overpowered the bearish momentum. On the other hand, a bearish engulfing candle forms when a red candlestick with a larger body completely engulfs the body of a smaller bullish green candlestick. This is often seen as an indication that the market is entering a downtrend, as the bearish momentum has overpowered the bullish momentum.
Conclusion
Candlestick charts indicate one of the fundamental tools utilized in technical analysis. While they offer the ability to illustrate market trends and identify potential turning points in real-time, their scope is limited to changes in market prices, failing to capture underlying market conditions. Moreover, candlestick charts can sometimes provide inaccurate signals, so traders need to double-check them with more analysis and confirmation. Therefore, a thorough analysis combining various technical indicators and other analytical methods should be conducted. This approach allows for the selection of an appropriate time frame and analytical methodology based on one's risk tolerance, prevailing market trends, and trading strategies.
FAQ
Q: Which cycle of candlestick charts is most suitable for the cryptocurrency market?
A: There is no definitive answer to this question as different traders may have different preferences and strategies. However, in general, the most commonly used time periods for candlesticks in the cryptocurrency market are 1-day, 4-hour, and 30-minute intervals, which represent long-term, medium-term, and short-term trends. Ultimately, the choice of which cycle to use will depend on the trader's trading style, risk tolerance, and investment goals.
Q: What does the color of candlestick charts represent and what does it indicate?
A: The color of a candlestick chart symbolize the price movement of an asset over a specific time period. In general, a green or white candlestick body indicates a higher closing price than the opening price, suggesting that the price is rising, while a red or black candlestick body indicates a lower closing price than the opening price, suggesting that the price is falling. By analyzing the color of candlestick charts along with other technical indicators, traders can gain insight into market sentiment and potential future price movements, which can inform their trading decisions.
This is not investment advice. Please conduct your own research when investing in any project.