Effective Trading: How To Read Crypto Futures Charts For Aussie Beginners
2024-06-25 11:03:50Introduction
Are you a beginner in cryptocurrency futures trading? Are you tired of staring at charts, trying to make sense of them? Fear not! This article is here to guide you through the process of reading cryptocurrency futures charts. Understanding these charts is essential for making informed decisions when trading and can help increase your chances of success. In this article, we will cover everything from the basics of futures charts to advanced charting techniques, including how to use moving averages for price analysis and identifying entry and exit points in futures trading. We will also discuss key terms used in futures trading, top indicators for crypto futures trading, and the importance of risk management in futures trading. By the end of this article, you will have a thorough understanding of how to read cryptocurrency futures charts and be ready to start making informed trades.
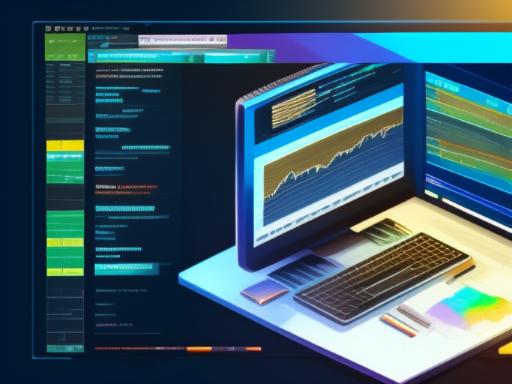
Understanding Cryptocurrency Futures Charts
Cryptocurrency futures trading is a popular method of trading that involves speculating on the future price movements of digital currencies such as Bitcoin, Ethereum, and Litecoin. In order to be successful in this type of trading, it is essential to have a good understanding of cryptocurrency futures charts.
A futures contract is an agreement between two parties to buy or sell an underlying asset at a predetermined price and date in the future. In cryptocurrency futures trading, these contracts are based on the price movements of digital currencies such as Bitcoin. Futures charts are used by Aussie traders to track these price movements and make informed decisions about when to enter or exit trades.
To understand cryptocurrency futures charts, it is important to have a basic understanding of technical analysis. This involves using historical data and chart patterns to predict future price movements. Traders use various tools such as trend lines, support and resistance levels, moving averages, and indicators such as MACD and RSI to analyze these charts and identify potential trading opportunities. By understanding these concepts, traders in Australia can make informed decisions about when to buy or sell cryptocurrency futures contracts.
Types of Futures Charts
There are different types of futures charts, each with its unique features, and selecting the appropriate chart type depends on your trading needs. The most common types are line charts, bar charts, and candlestick charts. Given that it signals a bullish reversal, a futures trading chart is vital for indicating a potential shift from a consistent downtrend or uptrend. As such, it might be an opportune time to consider entering a long position in the market.
Line charts track the price changes of an asset over a specific period by connecting closing prices in a straight line. Bar charts offer more details than line charts by showing opening and closing prices, highs and lows within a specified time frame. On the other hand, candlestick charts provide comprehensive information about an asset's price movements over time by using candle-shaped symbols to represent various price levels.
Choosing the appropriate chart type is crucial as it can affect your trading decisions. For instance, if you're interested in tracking short-term price changes and identifying entry or exit points quickly, you may consider using candlestick charts. Conversely, if you're interested in long-term trends or overall market movement, then a line chart may suffice.
Key Terms Used in Futures Trading
In order to be successful at trading cryptocurrency futures, it is important to familiarize yourself with the key terms used in futures trading. Understanding these terms will allow you to make more informed decisions and develop a deeper understanding of the market.
One term you should be familiar with is margin. Margin refers to the amount of money or cryptocurrency that you must have in your account in order to open a position. Another important term is leverage, which refers to the amount by which you can amplify your gains or losses based on the amount of margin you put up.
Other key terms include long and short positions, which refer to whether a Australian trader is betting on an asset’s rise or fall respectively. It's also important to understand settlement dates, as this is when trading contracts expire and are either settled or rolled over into new contracts. By understanding these key terms and more, you can better navigate the complex world of cryptocurrency futures trading.
Reading a Basic Bitcoin Futures Chart
To begin reading a basic Bitcoin futures chart, you must first understand the fundamentals of futures trading. In the cryptocurrency market, futures contracts are agreements to buy or sell an asset at a predetermined price and time in the future. The price of a futures contract is based on the current market price of the underlying asset, which in this case is Bitcoin.
When looking at a Bitcoin futures chart, there are several key elements to consider. The Y-axis represents the price of Bitcoin, while the X-axis represents time. Typically, each point on the chart represents a specific trading period, such as one hour or one day. The lines on the chart represent different moving averages that can provide insight into market trends and potential entry or exit points for traders in Australia.
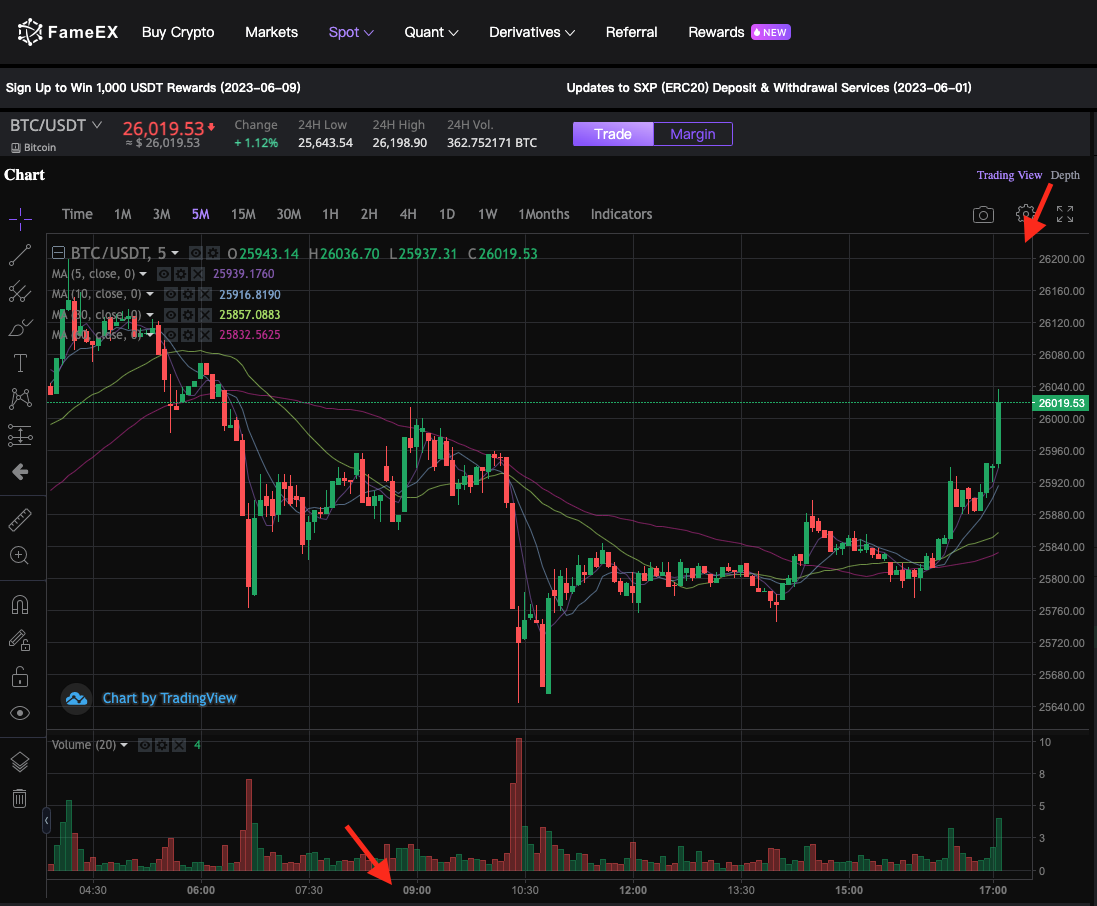
One important concept to understand when reading a Bitcoin futures chart is support and resistance levels. These levels are areas where Aussie traders tend to buy or sell assets due to historical patterns and market sentiment. By identifying these levels on a chart, traders can make more informed decisions about when to enter or exit trades. Overall, understanding how to read basic Bitcoin futures charts is crucial for anyone looking to get started with cryptocurrency trading.
Advanced Charting Techniques for Cryptocurrency Futures
To take your cryptocurrency futures trading game to the next level, it's important to learn advanced charting techniques. These will help you identify trends and patterns that can be missed with basic charts. One such technique is using Bollinger Bands. Bollinger Bands are a type of technical analysis tool that help measure volatility by tracking the standard deviation of an asset's price movement over time. They consist of three lines: the middle band is a moving average, while the upper and lower bands are plotted at a certain number of standard deviations away from the middle band.
Another advanced charting technique is using candlestick charts. These charts provide more detail than traditional line charts, as they display the open, close, high, and low prices for each time period in a visually appealing way. Candlestick charts can help you identify buying or selling pressure and potential trend reversals based on various patterns that can form. Despite their complexity, candlestick charts are widely used by Australian traders because they offer a rich, detailed view of the market that's not possible with simpler chart types. However, to make the most of these charts, traders need to study and understand a variety of patterns and indicators.
Fibonacci Retracement Analysis in Futures Trading
Fibonacci Retracement is a popular technical analysis tool that is used to determine potential levels of support and resistance in the market. This tool is based on the theory that markets will retrace a predictable portion of a move, after which they will continue to move in the original direction. Fibonacci retracements are drawn from the high and low points of a chart, commonly utilizing 38.2%, 50%, and 61.8% retracement levels.
When it comes to cryptocurrency futures trading, Fibonacci retracements can be an effective tool for identifying potential entry and exit points. These levels can be used to set stop-loss orders or take-profit targets based on previous market movements. However, it's important to note that Fibonacci retracements should not be relied upon as the sole factor for making trading decisions.
Overall, learning how to utilize Fibonacci retracements in cryptocurrency futures trading can provide valuable insights into market behavior and help traders make more informed decisions when entering or exiting positions. Understanding how this analysis tool works can give Aussie traders an edge in a highly competitive market with high volatility.
How to Use Moving Averages for Price Analysis
Leveraging moving averages is a crucial technique for price analysis in cryptocurrency futures trading. The moving average helps traders in Australia identify trends and potential support and resistance levels. In essence, it smoothens out the volatility of the market, allowing traders to make informed decisions based on historical prices.The most commonly used moving average in cryptocurrency futures trading is the simple moving average (SMA). This indicator calculates the average price of a cryptocurrency over a specific period, typically 20, 50, or 200 days. Traders can use this information to determine the overall direction of the market and identify potential trend reversals.
Another popular moving average is the exponential moving average (EMA), which gives more weight to recent prices than older ones. This approach aims to provide a more accurate representation of current market conditions by emphasizing recent price movements over historical ones. By leveraging both SMA and EMA techniques, traders can gain an even deeper understanding of trends in cryptocurrency futures markets.
Identifying Entry and Exit Points in Futures Trading
Identifying the right entry and exit points is critical when trading futures contracts. It requires an understanding of technical analysis, market trends, and risk management. Traders should use multiple indicators to confirm potential entry or exit signals.
One popular method is to use moving averages to identify trend reversals. When the price crosses above a moving average, it can signal a buy opportunity. Conversely, when it crosses below a moving average, it can indicate a sell opportunity. Another technique is to use support and resistance levels to identify potential entry or exit points.
Traders in Australia must also consider their risk tolerance when identifying entry and exit points. It's essential to have clear stop-loss levels in place to manage potential losses. Traders must also be patient and avoid being reactive to daily market fluctuations. By identifying the right entry and exit points and managing risk effectively, traders can improve their chances of success in futures trading.
Top Indicators for Crypto Futures Trading
One of the keys to success in cryptocurrency futures trading is identifying the right indicators to help you make informed decisions. There are a variety of technical indicators available, but some stand out as particularly useful for trading cryptocurrencies.The Relative Strength Index (RSI) is one popular indicator used by many Aussie traders. It helps assess whether a particular cryptocurrency is overbought or oversold, which can give insight into potential future price movements.
Moving Average Convergence Divergence (MACD) is another widely used indicator in crypto futures trading. It helps to identify changes in momentum and trend direction, which can be useful for identifying entry and exit points.
Finally, the Bollinger Bands indicator can help traders understand volatility in cryptocurrency prices. By visually representing upper and lower bands around a moving average, this indicator shows when prices are likely to experience significant movement.
Overall, combining these and other technical indicators with fundamental analysis can help Australian traders make better-informed decisions when trading cryptocurrencies on futures markets.
The Importance of Risk Management in Futures Trading
As exciting as futures trading may seem, it is important to note that it comes with substantial risks. Risk management is an essential element of successful futures trading, and it involves the use of strategies aimed at minimizing losses and maximizing gains. Proper risk management techniques can help Aussie traders survive the ups and downs of futures trading. One crucial aspect of risk management in cryptocurrency futures trading is setting stop-loss orders. A stop-loss order is an instruction given to an exchange to sell a particular asset when it reaches a specified price. By setting a stop-loss order, you can limit your losses if the market moves against you. It is important to set your stop-loss order at a level that enables you to absorb minor fluctuations in prices while still being able to exit the market before significant losses occur.
Another vital element of risk management is diversification. Placing all your eggs in one basket can be catastrophic when things go wrong in the market. To minimize risks associated with volatility, consider spreading out your investment across various cryptocurrencies or assets within different industries. This way, if one asset performs poorly, others are likely to make up for those losses. By diversifying your portfolio, you increase your chances of success while minimizing risks associated with uncertainty in the market.
By mastering the art of risk management in cryptocurrency futures trading, you put yourself in a better position for success while minimizing potential financial loss. Remember that every trade comes with its unique risks; hence proper preparation and planning are necessary for successful trades over time.
Conclusion
Reading cryptocurrency futures charts can be a complex and daunting task for beginners, but with practice and patience, it can become a valuable tool in your trading arsenal. Understanding the different types of charts and key terminology is essential to effectively analyze price movements and identify potential entry and exit points. Advanced charting techniques such as Fibonacci retracement analysis and moving averages can provide greater insight into market trends. Remember to always prioritize risk management strategies to minimize losses and maximize profits. By implementing these strategies, you can become a successful trader in the exciting world of cryptocurrency futures.
This is not investment advice. Please conduct your own research when investing in any project.