What Is Williams %R Indicator in Trading and How to Use It?
2023-05-31 14:35:40Brief Intro to the Williams %R Indicator
The Williams %R indicator is a technical analysis tool used for short-term market analysis. Invented by the famous technical analyst Larry Williams in the 1960s, this indicator was originally used to determine overbought and oversold conditions in the stock market. However, it can also be applied to the cryptocurrency market and play a significant role.
The Williams %R indicator shows “the relative position of the closing price within a range of highs and lows over a period of time", providing insights into whether an asset price is currently in a strong or weak trend.
What Is Williams %R Indicator?
The Williams %R indicator is a popular tool used to determine overbought and oversold market conditions and to identify potential trend reversals. It has a value range of -100 to 0, with the overbought and oversold thresholds set at -20 and -80, respectively. If the indicator is above -20, it indicates that the market is in an overbought state, which means that the price is likely to fall in the future. Conversely, if the indicator is below -80, it suggests that the market is oversold, implying that the price is likely to rebound later.
What Is the Formula to Calculate the Williams R% Indicator?
The formula is as follows:
・ %R = (Highest High - Current Close) ÷ (Highest High - Lowest Low) × -100
And
・ Highest High indicates the highest price in the lookback period.
・ Lowest Low indicates the lowest price in the lookback period.
・ Current Close indicates the most recent close price.
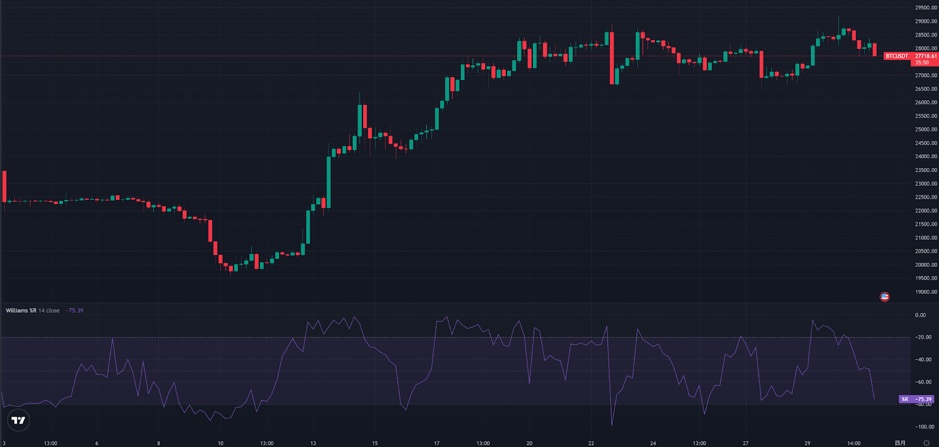
The Williams %R indicator typically uses a 14-day lookback period for its calculations. By calculating the %R value, traders can obtain insights into the market trend and identify whether the market is at an overbought or oversold level.
As shown in the following figure, the Williams %R indicator refers to the line in purple.
William %R Indicator Principles and Features
This indicator evaluates situations of overbuying and overselling. It does this by comparing the difference between the latest high and low prices with the gap between the current price and the recent highest price. Generally, a buoyant market corresponds with an increase in the value of the Williams %R indicator. Still, when the market experiences a downturn, the indicator’s value will also decline. If the indicator is above -20, it is usually seen as an overbought signal, meaning that a pullback or correction may occur, while a value below -80 typically refers to an oversold signal, implying that a rally or a rebound may be imminent.
Features of the Williams %R Indicator:
1. Particularly suitable for short-term trading: The Williams %R indicator is often used for short-term trading because of its ability to quickly present market changes.
2. Reflect the market sentiment: The indicator can be used to gauge whether the market is experiencing excessive fear or greed. A value between -80 and -100 is typically seen as a sign of a highly fearful market, while a value between 0 and -20 is often viewed as an indication of an overly optimistic market.
3. Clear overbought and oversold signals: If the indicator is above -20, it is usually interpreted as an overbought signal, indicating a trader can sell out or go short. If the indicator is below -80, it gives an oversold signal that buying in or going long is viable.
4. Easy to use: The calculation method of the Williams %R indicator is simple and easy to understand, through which the market sentiment can be revealed quickly.
5. Extensive applications: The Williams %R indicator is applicable to various markets, including cryptocurrencies, stocks, futures, foreign exchange, etc.
Common Williams %R Pattern
The Williams %R indicator fluctuates between 0 and -100, with -20 as a criterion to determine whether the market is overly optimistic and -80 to determine whether the market is overly fearful.
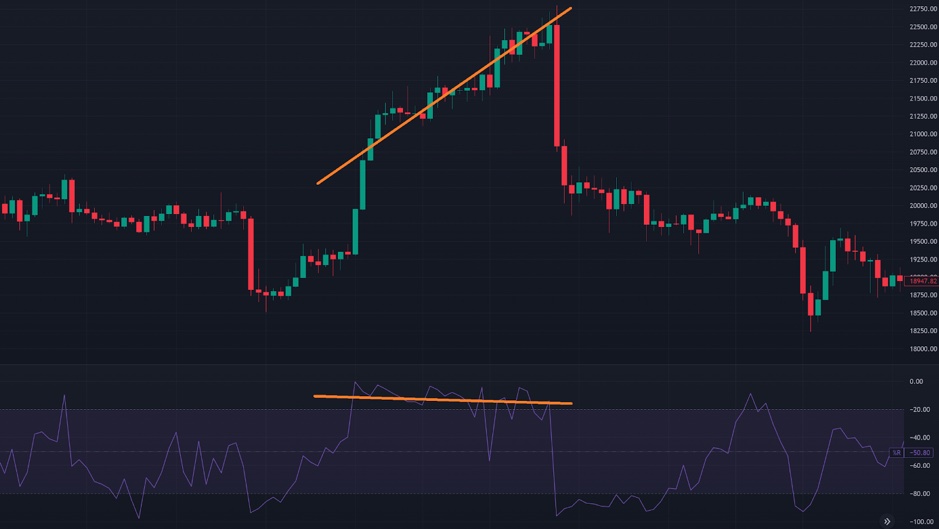
William R% Trend Proportional to the Price
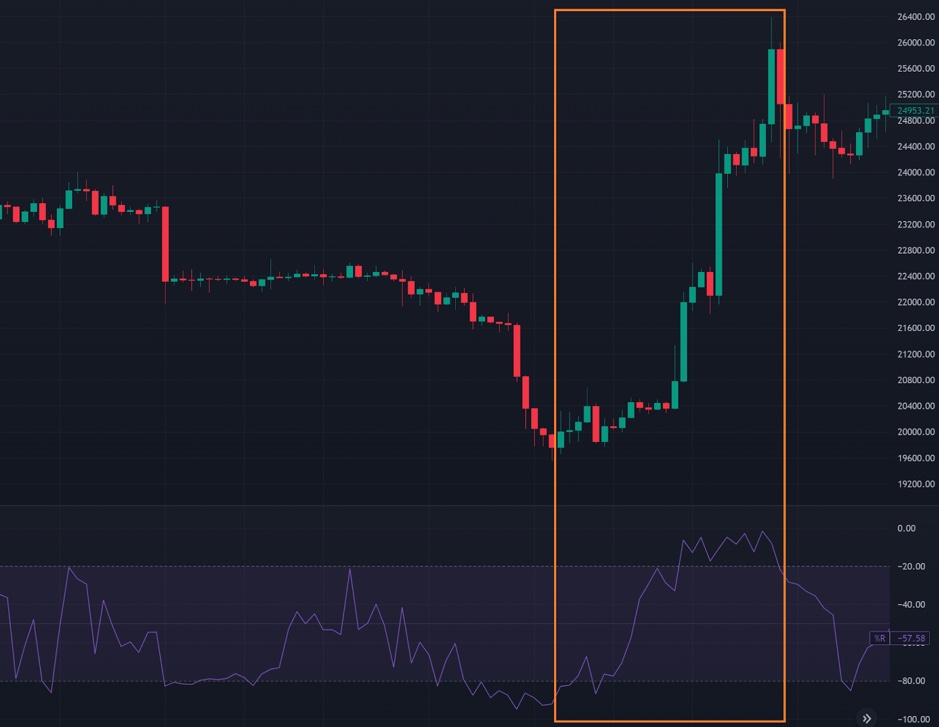
It’s common for prices to rise or fall in response to an upward or downward Williams %R, respectively, which indicates that the market is more likely to continue moving in its original direction.
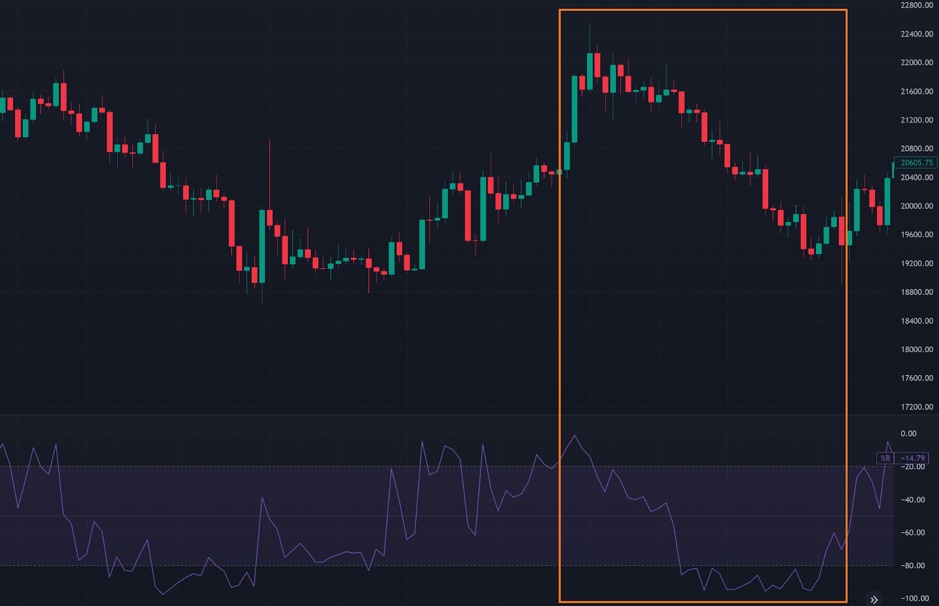
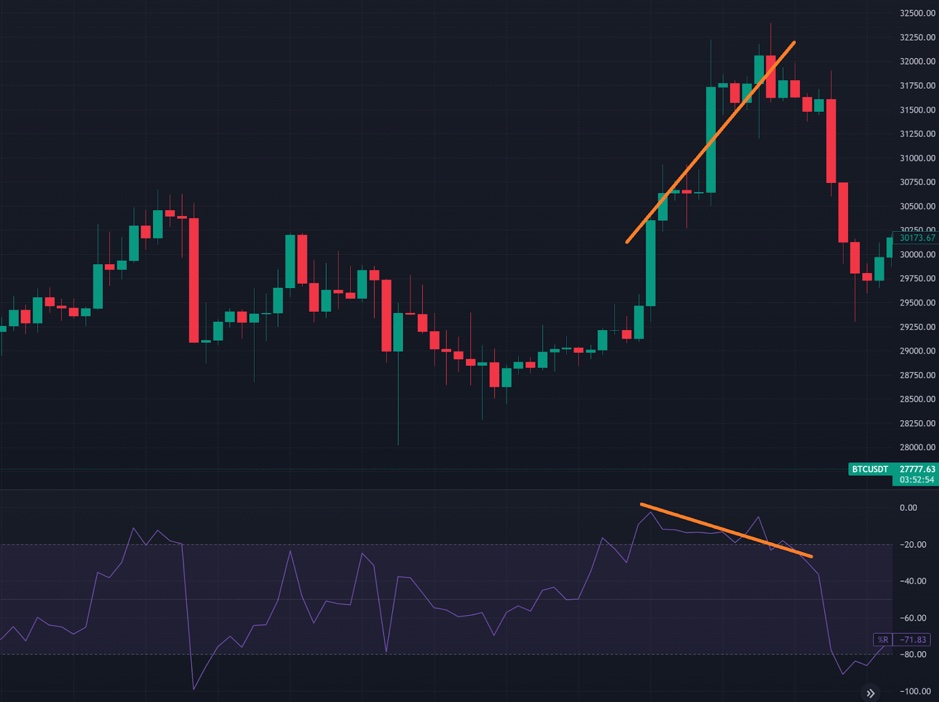
Bearish Divergence
In technical analysis, a divergence in the William %R indicator means that the market price trend is the reverse of the indicator trend.
A bearish divergence occurs when the asset price continues to rise and make new highs over time, but the Williams %R indicator fails to follow suit and instead becomes flat or even starts to decline. This implies that there may be fewer buyers entering the market. It is usually interpreted as a signal that the market is about to reverse and the trend is about to shift. For instance, a long market may shift to a short market. It is recommended that investors consider selling out or going short.
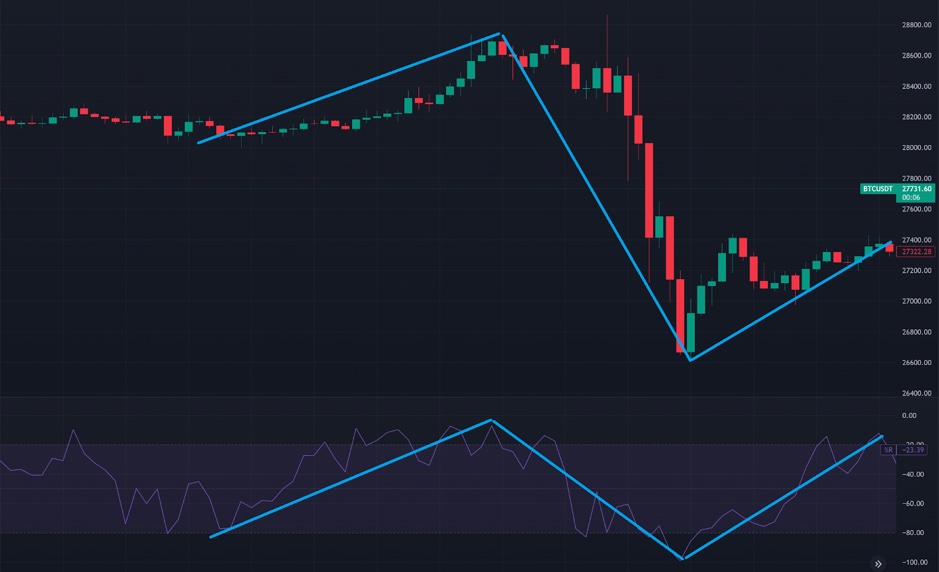
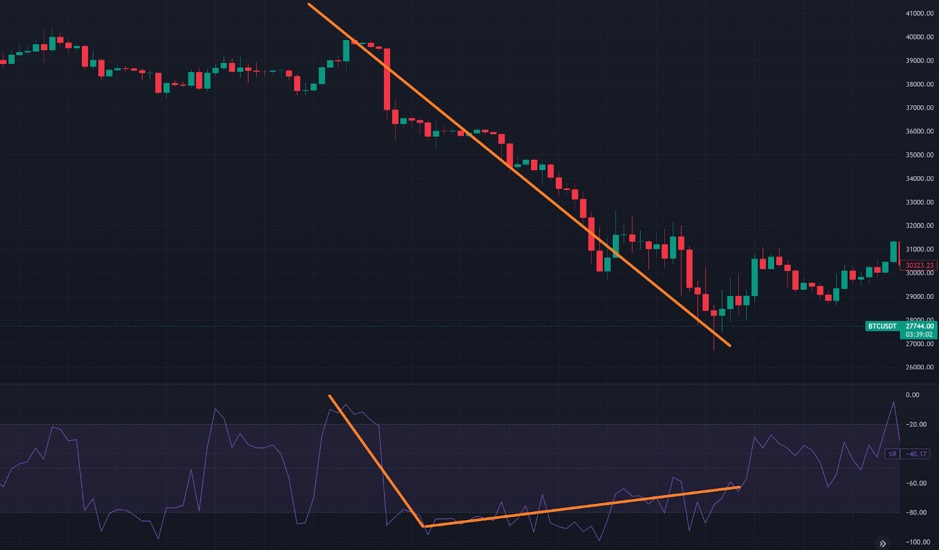
Bullish Divergence
A bullish divergence is when the asset price continues to fall to a new low over a period of time, while the indicator stops making a new low, illuminating a flattening or rising indicator. In this case, the market’s selling power is weakening, which indicates that the market may reverse and the trend is about to shift. For example, it may change from a short market to a long market. Thus, investors may buy in or go long.
How to Use the Williams %R Indicator?
The Williams %R indicator is mainly used to determine whether the market is overbought or oversold, as well as the divergence between the indicator and the price. Below are some crucial points when using the indicator to identify trends:
1. Identify the overbought range: An indicator value over -20 refers to an overbought market that is overly optimistic. In this case, there is a risk that the price will fall back, enabling investors to perform short trading.
2. Determine the oversold range: If the indicator is below -80, the market may remain in oversold conditions which are overly panicky. As a result, the price stands to display a rising rebound, and investors can carry out long trades.
3. Divergence: A divergence may occur when the price action and the Williams %R indicator show inconsistencies. A bullish divergence, where the price creates a new low instead of the indicator, may signal the conclusion of a bear market and the start of a bullish rally. On the other hand, a bearish divergence occurs (the price makes a new high while the indicator does not), suggesting the end of a bull market and the beginning of a bearish decline.

Can the Williams %R Indicator Work with Others?
This indicator excels in determining short-term trends, well-suited for short-term trading. Therefore, it can be complemented by medium- and long-term technical indicators, such as the Moving Average Convergence Divergence (MACD) indicator, the Simple Moving Average (SMA) indicator, and the exponential moving average (EMA) indicator.
Conclusion
The Williams %R indicator is essential in short-term trading as it helps investors identify market trends and overbought/oversold conditions to determine entry and exit points. Nonetheless, to enhance the accuracy of trading decisions, it is advisable to combine the Williams %R indicator with other analysis tools.
FAQ
Q: How to use the Williams %R indicator in crypto trading?
A: When the Williams %R value is above -20, it indicates an overbought market, which could be a signal to sell out or go short. Conversely, an indicator value less than -80 implies an oversold market, which may suggest an opportunity to buy in or go long.
This is not investment advice. Please conduct your own research when investing in any project.