Mastering the Art of Reading Crypto Charts: The Complete Guide for Newbie Traders
2024-02-08 09:57:00
Crypto charts are essential tools for anyone involved in the cryptocurrency market, whether you're an experienced trader or a newcomer. These charts provide a visual representation of the price movements and market trends of various cryptocurrencies over time. This guide aims to demystify the components of crypto charts and explain how to interpret the data they present effectively.
Introduction to Crypto Charts: Understanding the Basics
Mastering the art of reading cryptocurrency charts is crucial for traders aiming to capitalize on market opportunities. Technical analysis, the study of statistical trends over time, plays a pivotal role in deciphering the impact of supply and demand on an asset's future price movements. By analyzing crypto market charts, investors gain the insight needed to make informed decisions, anticipating the end of bullish (upward) and bearish (downward) price movements. In essence, 'bulls' (buyers) drive prices up, while 'bears' (sellers) push them down. Utilizing technical analysis, traders can identify trends and patterns in these charts, uncovering potential trading opportunities. While the best crypto charts are instrumental in tracking market dynamics, they come with their own set of complexities and nuances. By understanding the basics of crypto charts, you can gain valuable insights into market behavior, helping you make more informed decisions.
Importance of Reading Crypto Charts for Traders
Reading crypto charts is crucial for traders as they offer a wealth of information essential for making informed trading decisions. These charts not only display price movements over various time frames but also reveal patterns and trends in the market. Understanding these patterns can help traders anticipate potential price movements, allowing them to strategize their trades more effectively. Therefore, mastering the art of reading crypto charts is a fundamental skill for successful trading in the volatile cryptocurrency market.
Breaking Down the Components of a Crypto Chart
Crypto charts consist of several key components that together provide a comprehensive view of market activity. The price axis, typically on the right side of the chart, represents the levels at which a cryptocurrency is being traded. The timeframe, which runs along the bottom, shows the selected timeframe for the data, ranging from minutes to days, weeks, or even years. Other elements include volume bars, which indicate the amount of cryptocurrency traded within a specific period, and various technical indicators that traders use to analyze market trends and predict future movements.
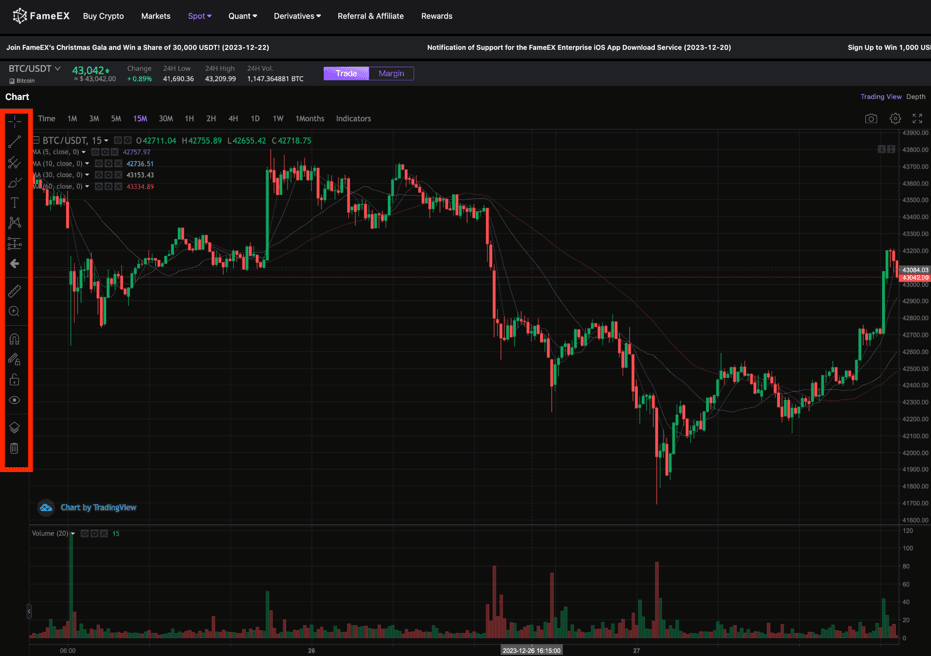
Cryptocurrency exchanges like FameEX often display a dynamic price chart for each trading pair. These pairs usually involve a chosen cryptocurrency and USDT, although pairing with other fiat currencies or cryptocurrencies is also common.
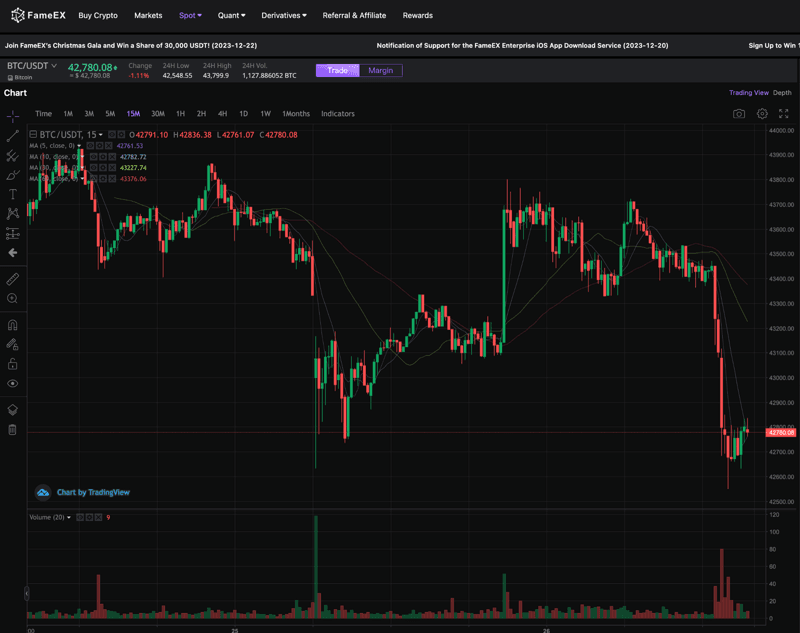
The chart provides crucial data points that form the foundation for various indicators used by traders in the cryptocurrency market. This chart above includes several essential data points:
- Trading Pair: This indicates the base currency (BTC) and the quote currency (USDT) in the market.
- Current Price: Reflects the ongoing price of the base currency (BTC) in terms of the quote currency (USDT). This includes indicators of price change over the last 24 hours, which can fluctuate rapidly based on market activity.
- Price Chart: Depicts the price fluctuations over time. In crypto markets, each unit of time is often represented by a candlestick, and a series of these candlesticks reveals the recent price trend of an asset. Time frames can be adjusted from a 24-hour view to several months or years.
- High/Low: Shows the maximum and minimum prices of the asset within a 24-hour period.
- Trading Volume: Displayed in a chart beneath the main price chart, it shows the trading volume for an asset. Each bar corresponds to the trading volume for a particular time period, with longer bars indicating higher volumes. Typically, green bars represent a price increase and red bars a decrease, though colors can be customized.
- 24H Volume: Represents the amount of the asset (BTC) traded in the past 24 hours, denominated in the quote currency (USDT).・Timeframe: Allows users to select desired time intervals for viewing the market, ranging from one minute to one month.
A key feature of these charts is the collection of candlesticks that compose the price chart, offering a visual representation of price movements over time.
Types of Charts: Line Chart, Bar Charts and Candlestick Chart
There are three main types of charts used in cryptocurrency trading: line charts, bar charts, and candlestick charts. Line charts are the simplest, showing the closing price of a cryptocurrency over a specified period. Bar charts provide more detail, displaying the opening, closing, high, and low prices for each period. Candlestick charts offer a similar level of detail to bar charts but are visually more informative, using colors to indicate whether the price rose or fell during the period.
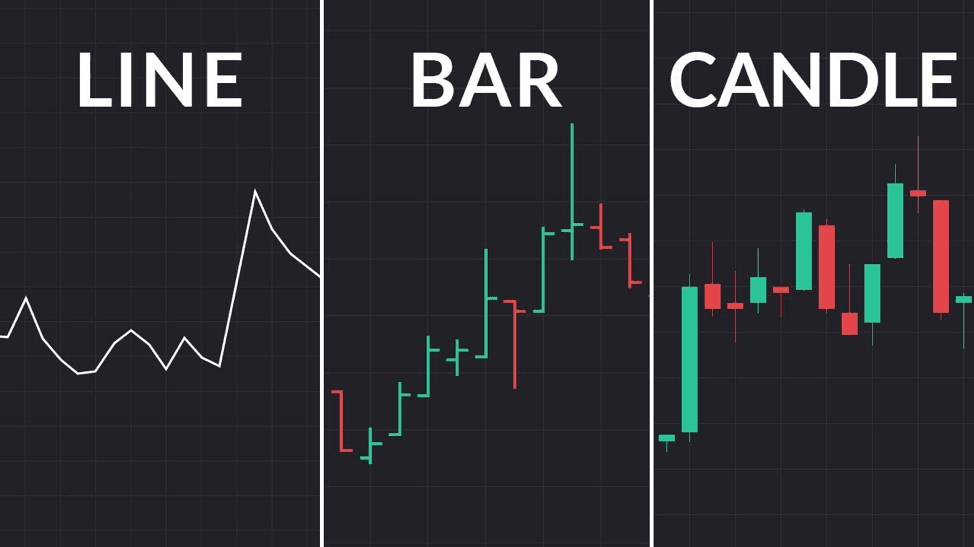
Source from Trading 202 YouTube
Understanding Price on a Cryptocurrency Chart
Correctly reading and interpreting the price information on a cryptocurrency chart is vital for making wise trading decisions. The price data reflects the value of a cryptocurrency at any given time and is influenced by various factors, including market demand, investor sentiment, and broader economic indicators. Traders must learn to discern the significance of price movements and patterns, such as support and resistance levels, to predict future price actions effectively in the market trend.
Why do Cryptocurrency Market Trends Matter?
Market trends in cryptocurrency are critical for traders as they indicate the general direction in which the market is moving. Understanding these trends allows traders to align their strategies with the market momentum, either by riding an upward trend for potential profits or by anticipating a downward trend to minimize losses. Recognizing trends also helps in identifying key buying or selling opportunities, making trend analysis an indispensable part of crypto trading. Trendlines are a crucial tool in technical analysis, aiding in the prediction of market movements and price changes. Below, we delve into the broad applications of the trendline principle and its significance in investing and trading.
・The Significance of a Breakout Above a Trendline
When a certain crypto price breaks above a trendline, this often signals a shift in the market trend. A breakout above an uptrend line suggests increased buying momentum, presenting a potential buying opportunity. Conversely, a breakout above a downtrend line might indicate stronger selling pressure, signaling a possible selling opportunity.
・Support and Resistance in Trendlines
A crypto price reacting to a trendline—either bouncing off or falling near it—demonstrates the trendline's role as both support and resistance. Near an uptrend line, investors might consider buying, as the trendline can offer support. However, as the price nears a downtrend line, selling could be a prudent move, given the trendline's resistance.
・Consolidation in Trendlines
Consistent adherence to a trendline by a crypto price suggests stability in market forces, either buying or selling. However, trendlines can shift, necessitating vigilance when applying the trendline principle.
While the trendline principle is versatile in predicting market movements and guiding trading strategies, its effectiveness hinges on understanding both its persistence and uncertainty. Combining market trend analysis with other technical indicators and fundamental analysis is essential for making more accurate investment decisions.
Diving into Technical Analysis: Deciphering Crypto Chart Patterns
Technical analysis is a cornerstone of cryptocurrency trading. This method involves deciphering chart patterns to predict future market behavior. In the dynamic world of cryptocurrencies, where prices fluctuate rapidly, understanding these patterns is crucial for traders looking to capitalize on market movements. This section of the guide delves into the intricacies of crypto chart patterns, offering insights into how traders can use technical analysis to their advantage.
Understanding Support and Resistance Levels on a Crypto Chart
Support and resistance levels are fundamental concepts in the technical analysis of crypto charts. The support level is where the price tends to find a floor, as buying interest is strong enough to overcome selling pressure. Conversely, the resistance level is where the price hits a ceiling, with selling interest overpowering buying momentum. Identifying these levels helps traders understand potential turning points in price movements, providing clues for entry and exit points in their trading strategies.
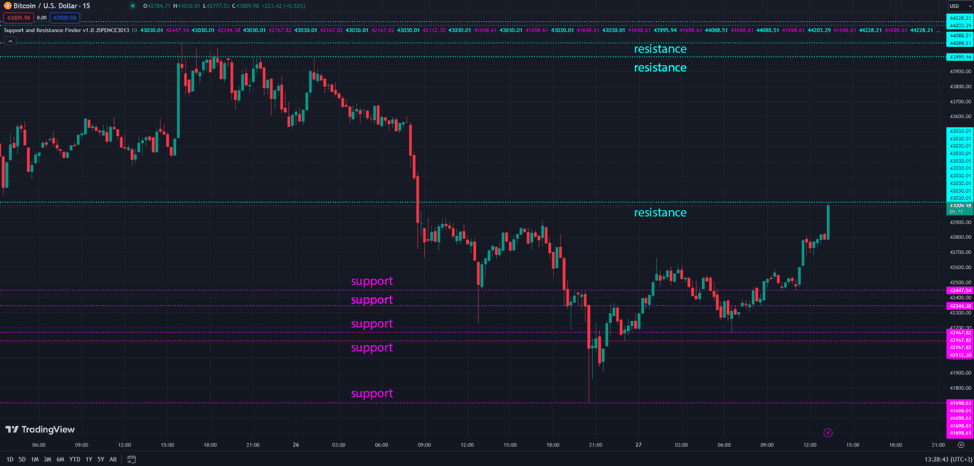
Support and Resistance level in BTC/USDT, source: TradingView
How to Read Candlestick Patterns in Crypto Charts?
Candlestick patterns are a critical tool in interpreting crypto charts. These patterns, formed by the price movements of a cryptocurrency, can indicate potential market trends and reversals. First, navigate to the FameEX platform and access the spot trading page. In the center, you will find the crypto charts. On the left side, there are support tools available to assist you in drawing lines on the chart, helping you identify trends. At the top, you can select timeframes ranging from 1 minute to 1 month. This feature enables you to analyze both short-term and long-term market trends. Additionally, you can apply various indicators to the chart for enhanced analysis.
Understanding these patterns allows traders to anticipate market movements and make more informed decisions. Candlestick patterns are essential in technical trading for forecasting market trends and price movements. Among these, certain patterns are particularly noteworthy.
The Role of Trading Volume in Analyzing Crypto Price Trends
Trading volume plays a significant role in analyzing crypto price trends. It represents the total number of cryptocurrencies bought and sold over a period and can be an indicator of the strength or weakness of a price movement. For instance, a price increase accompanied by high trading volume might suggest a strong upward trend, while the same increase with low volume could indicate a lack of conviction among traders.
Predict Future Price Movements Using Technical Analysis
To predict future price movements using technical analysis, traders often rely on core technical indicators and tools. These include moving averages, which smooth out price data to identify trends; the Relative Strength Index (RSI), which assesses whether a cryptocurrency is overbought or oversold; and the Moving Average Convergence Divergence (MACD), which detects changes in momentum. By combining these tools, traders can better understand market sentiment and anticipate future price movements.
・Head and Shoulders: This pattern is a reliable indicator of a trend reversal, usually from an upward to a downward direction. It features three peaks: a taller central peak (the head) flanked by two shorter ones (the shoulders). The pattern is considered complete when prices drop below the neckline - a support level connecting the two shoulder lows. Its effectiveness is maximized in the context of a pre-existing upward trend.
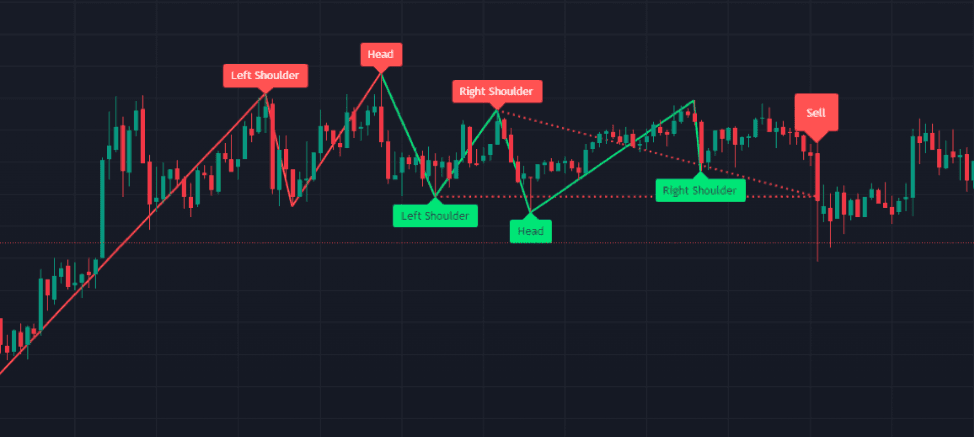
Head and Shoulders Patterns, source: TradingView
・Bullish and Bearish Engulfing Patterns: These involve two candles. In a bullish engulfing pattern, a smaller red (bearish) candle is followed by a larger green (bullish) candle, which 'engulfs' the red candle and closes above its high. A bearish engulfing pattern starts with a green candle, followed by a larger red candle that engulfs the green one.
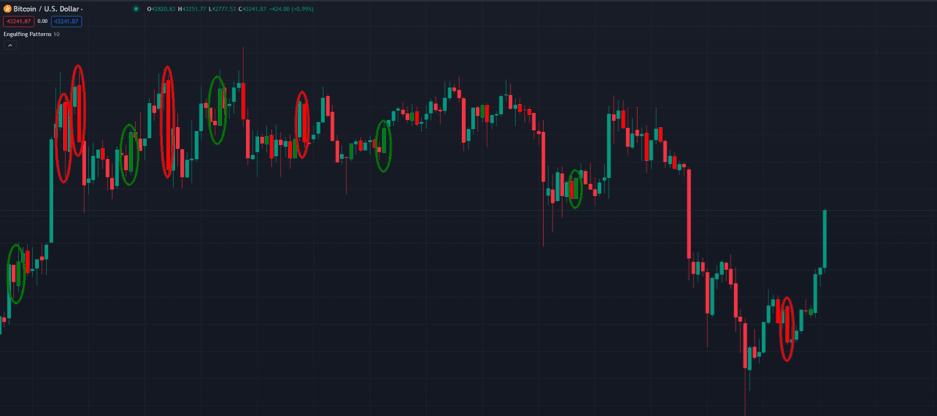
Green for Bullish and Red for Bearish Engulfing Patterns, source: TradingView
・Doji Candle: Characterized by having no body (open and close prices are identical), a Doji candle signifies market indecision and potential price reversal. The term "Doji," originating from Japanese rice traders, translates to 'error,' highlighting the rarity of such price stability.
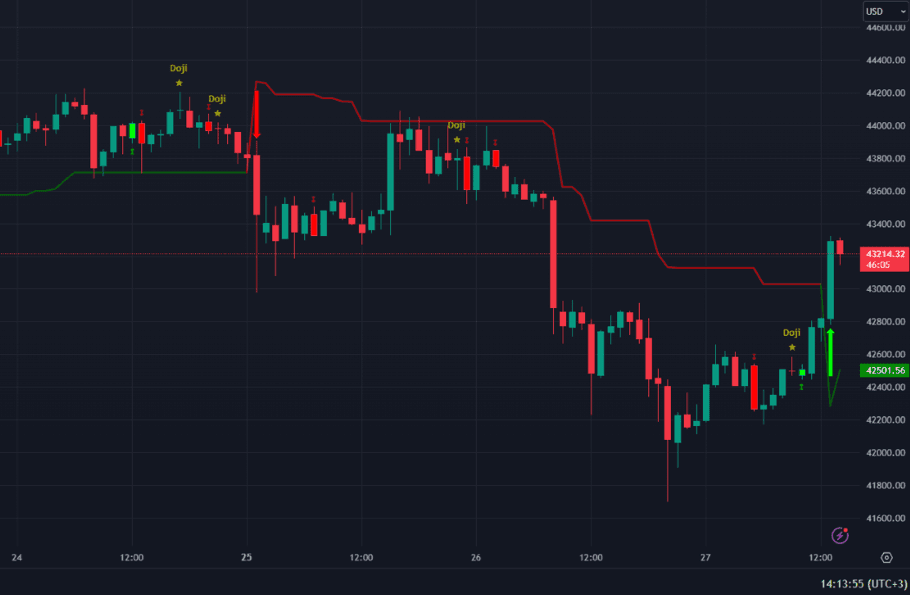
Doji Candle Patterns, source: TradingView
・Hammer and Hanging Man: These have a long lower wick. A red umbrella, or hammer, often indicates strong buying interest, hinting at a potential price rise. Conversely, a green umbrella, known as a hanging man, signals selling interest and a possible reversal of an upward trend.Each pattern has distinct features that help traders identify and react to potential market movements. By understanding these differences, traders can better discern market trends and make informed decisions. For more in-depth research, you can find our article here.
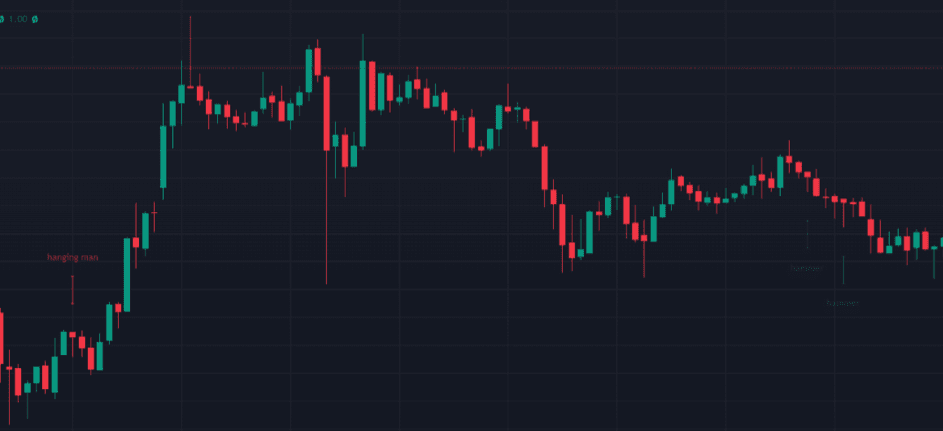
Hammer and Hanging Man Candle Patterns, source: TradingView
How Crypto Traders Use Chart Patterns for Their Trading Strategies?
Crypto traders integrate chart patterns into their trading strategies to identify potential buying and selling opportunities. By recognizing patterns such as 'head and shoulders,' 'triangles,' and 'flags,' traders can predict where the market might be headed next. These patterns, combined with other technical analysis tools, form the backbone of many trading strategies, enabling traders to navigate the volatile cryptocurrency markets with more confidence and precision.
Demystifying Candlestick Charts in Crypto Trading
Candlestick charts are an integral part of crypto trading, providing a depth of information within a simple visual format. Originating from Japan, these charts have become a global standard for displaying price movements in financial markets, including cryptocurrencies. They offer more data than traditional line charts, showing not just the closing price but also the opening, high, and low prices for a specific time period. This comprehensive guide aims to demystify candlestick charts, helping traders understand and utilize this powerful tool to enhance their trading strategies in the volatile crypto market.
The Anatomy of a Candlestick in a Crypto Chart
The anatomy of a candlestick in a crypto chart is fundamental to understanding how it conveys information. Each candlestick represents price movements within a specified time frame, which can range from a minute to a day or more. The main body of the candlestick shows the opening and closing prices, while the lines or 'wicks' extending from the top and bottom indicate the highest and lowest prices during that period. The color of the candlestick typically denotes whether the closing price was higher (often green or white) or lower (usually red or black) than the opening price. Also, you have the option to adjust the color whenever you wish, based on your personal preferences and the framework of your trading strategy.
Understanding the Significance of Wick, Open, and Close Prices
In a candlestick chart, the wick, open, and close prices are crucial for understanding market sentiment. The length of the wick can indicate the volatility within the trading period. A long wick might suggest that the price was pushed in a particular direction but then pulled back, showing resistance. The open and close prices, as depicted by the body of the candlestick, reflect the market's decision-making during that period. A candlestick where the close is much higher than the open suggests strong buying pressure, while the opposite indicates selling pressure.
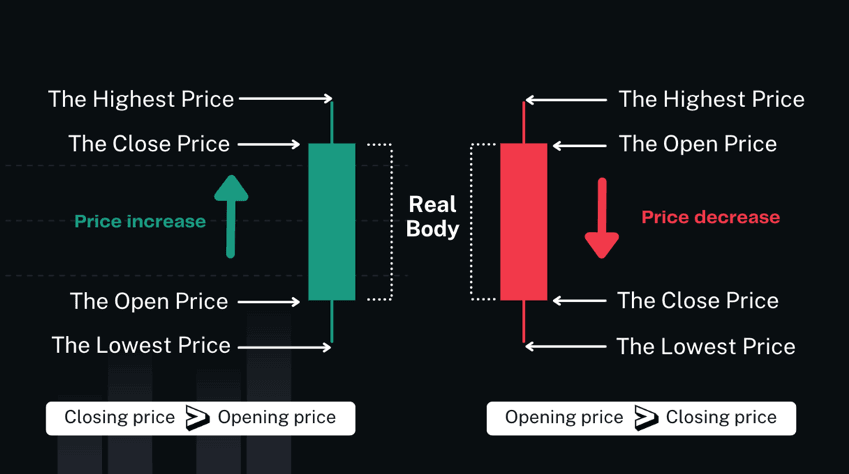
The body length of the candlestick is an indicator of market pressure. A longer body suggests a significant price movement, whereas a shorter body indicates a more minor price change. Understanding how to interpret red and green candlesticks in cryptocurrency pairs is crucial.
Candlestick Patterns and What They Indicate
Candlestick patterns are groups of one or more candlesticks that help predict future price movements. Simple patterns like the 'Doji', which has a small or nonexistent body, can indicate indecision in the market. More complex patterns, such as the 'Morning Star' or 'Evening Star', involve multiple candlesticks and can signal a reversal in the current trend. Recognizing these patterns and understanding what they indicate is crucial for predicting market movements.
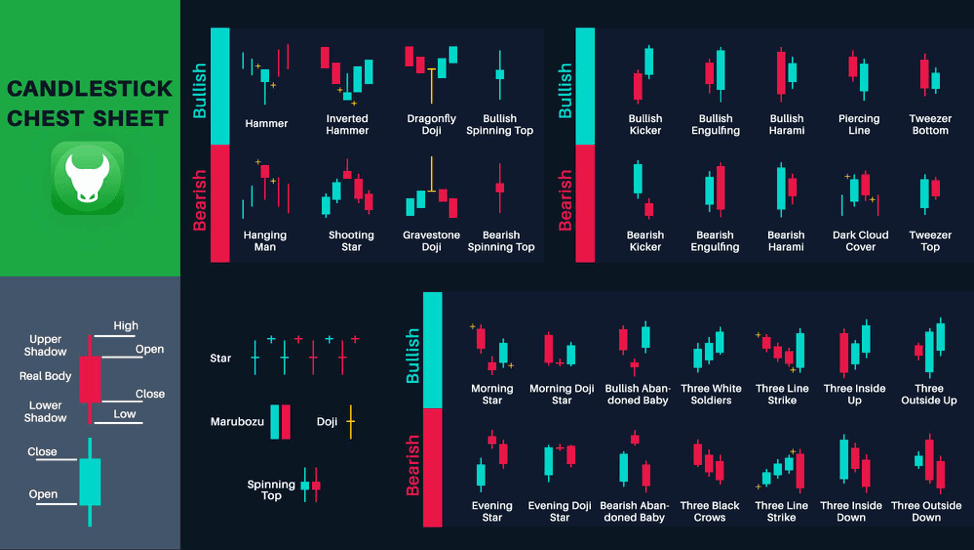
Different patterns for candlestick chart, Source: Trendo
Interpreting Bullish and Bearish Candlestick Patterns
Bullish patterns suggest that prices are likely to rise and may include formations like the 'Hammer' or 'Bullish Engulfing'. Conversely, bearish patterns, such as the 'Shooting Star' or 'Bearish Engulfing', hint at a potential decline in prices. The ability to correctly interpret these patterns allows traders to position themselves accordingly in the market.
- Bullish Patterns: Characterized by a sequence of increasing lows, each higher than the last, coupled with rising highs, each surpassing its predecessor. This pattern is a sign of trader confidence, indicating a bullish market sentiment.
- Bearish Patterns: In contrast, a downward trend is marked by a series of declining highs, each lower than the one before, and falling lows, each dipping below its previous mark. This pattern typically signifies a bearish market sentiment.
Applying Candlestick Chart Analysis for Crypto Trades
Applying candlestick chart analysis to crypto trades involves more than just recognizing patterns. It requires understanding the context in which these patterns form, including market trends and volume. Traders often combine candlestick analysis with other technical indicators for a more robust trading strategy. By doing so, they can better gauge market sentiment and momentum, making more informed decisions on when to enter or exit a trade. This comprehensive approach to candlestick chart analysis is key to navigating the complexities of the crypto market.
Learning to Use Technical Indicators in Crypto Chart Analysis
Technical indicators play a pivotal role in deciphering market trends and making informed decisions. These indicators are mathematical calculations based on the price, volume, or open interest of a cryptocurrency. They provide traders with insights that are not immediately apparent from just looking at the price chart. Understanding and effectively utilizing technical indicators is a vital skill for any crypto trader. This guide aims to introduce and demystify these tools, helping new and seasoned traders alike to enhance their chart analysis and improve their trading strategies.
Role of Technical Indicators in Reading Crypto Charts
Technical indicators are essential in reading crypto charts as they help in analyzing market trends and predicting future price movements. They offer a more structured approach to understanding the complexities of the crypto market. Indicators can show whether a cryptocurrency is overbought or oversold, gauge market momentum, and identify potential reversal points. By incorporating these indicators into their analysis, traders can make more calculated decisions, reducing reliance on guesswork and intuition.
Key Technical Indicators for New Crypto Traders
For new crypto traders, starting with a few key technical indicators can be immensely beneficial. The Relative Strength Index (RSI) is a popular momentum indicator that measures the speed and change of price movements, helping identify overbought or oversold conditions. Moving Averages (MAs), including the Simple Moving Average (SMA) and the Exponential Moving Average (EMA), help smooth out price action and identify trends. The Moving Average Convergence Divergence (MACD) is another crucial tool, used to spot changes in momentum and potential trend reversals. These indicators, when used in conjunction, can provide a comprehensive view of the market, aiding traders in their decision-making process.
Boosting your Trading Performance: Reading Crypto Charts Like a Pro
Reading crypto charts proficiently is a fundamental skill for elevating your trading performance. In the volatile world of cryptocurrency trading, being able to interpret charts accurately can be the difference between success and failure. This section of our guide focuses on refining your chart-reading abilities, transforming you from a novice to a pro. By mastering the art of analyzing crypto charts, you can make more informed decisions, understand market trends better, and ultimately enhance your trading results.
Enhancing Your Crypto Trading Chart Technique: Tips for Reading Crypto Charts
To enhance your crypto trading chart technique, there are several key tips to keep in mind. First, familiarize yourself with different chart types like line, bar, and candlestick charts, each offering unique insights. Focus on understanding technical indicators such as the RSI, MACD, and moving averages, as they can provide vital clues about market trends and potential reversals. Practice identifying patterns like head and shoulders, triangles, and flags, which can signal future price movements. Also, don't overlook the importance of volume, as it can validate the strength of a price movement. Lastly, continuously educate yourself and stay updated with market news, as the crypto world evolves rapidly.
Case Study: Successful Trading Decisions Based on Crypto Chart Analysis
Consider a case study of a successful trader who bases their decisions on crypto chart analysis. This trader consistently uses a combination of technical indicators to gauge market sentiment and potential price movements. For instance, by observing a bullish divergence on the RSI and a crossover in the MACD, the trader predicts an upcoming upward trend and positions themselves accordingly.
To conduct a thorough analysis, it's essential to start by examining longer timeframes. This approach helps identify key resistance and support levels, as well as the overall trend of the price movement. Once this is established, we can then focus on smaller timeframes to scrutinize the price movement channel, assessing potential breakouts or the likelihood of the price continuing in its original direction.
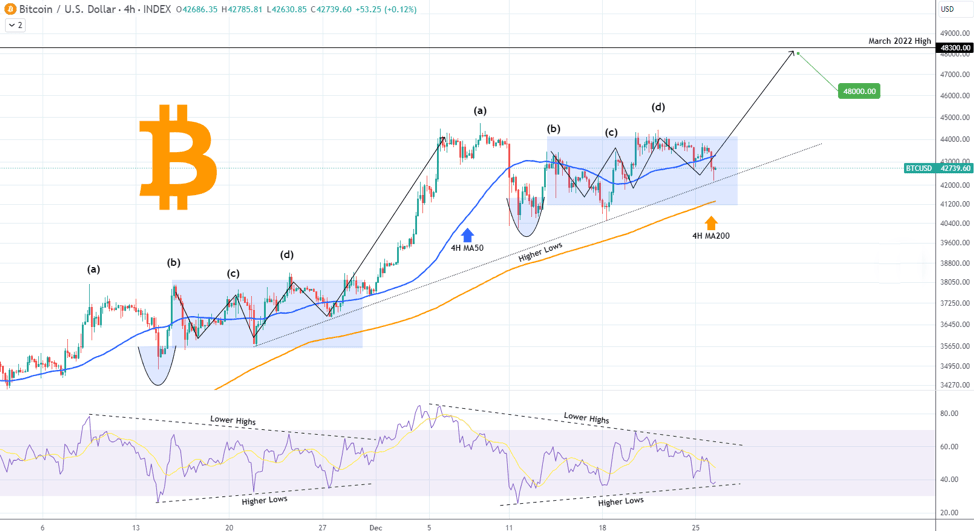
Source: TradingView
Let's take Bitcoin (BTCUSD) as an example. Currently, it is testing the 1-month Higher Lows trend line, which has supported the price action since the low level on November 22. Although the 4H MA50 (blue trend line) has been acting as a pivot, the 4H MA200 (orange trend line) has remained intact, providing support since October 15, and is positioned just below the Higher Lows trend line. Technically, the price action from December 8 until now bears similarities to that observed between November 9 and November 27. Following the bottom of the (d) wave on the Higher Lows trendline, there was a rally of over 21%. If this pattern repeats, we can expect the March 2022 high of 48,300 to be tested again.
By combining these technical analyses with a disciplined risk management strategy, the trader successfully capitalizes on significant market movements, demonstrating the power of proficient chart reading in crypto trading.
Conclusion
Mastering the art of reading and analyzing crypto charts is an indispensable skill for anyone keen on succeeding in the cryptocurrency trading arena. This guide has provided comprehensive insights into various aspects of crypto chart analysis from understanding the basics of candlestick charts to employing advanced technical indicators. We've explored how to interpret key patterns, gauge market sentiment, and make informed trading decisions. The case study highlighted reinforces the practical benefits of this knowledge, showcasing how strategic chart analysis can lead to successful trading outcomes. Whether you're a novice or an experienced trader, continuously honing these skills and staying abreast of market trends is crucial in the ever-evolving and dynamic world of cryptocurrency trading.
FAQ About Reading Crypto Charts
Q: What are the most important technical indicators for crypto chart analysis?
A: The most crucial technical indicators in crypto chart analysis include the Relative Strength Index (RSI), Moving Averages (such as SMA and EMA), and the Moving Average Convergence Divergence (MACD). These indicators help identify market trends, momentum, and potential reversal points.
Q: What are common mistakes in reading crypto charts and how to avoid them?
A: Common mistakes include over-reliance on indicators without considering market context, ignoring volume, and misinterpreting chart patterns. To avoid these, use indicators in conjunction with market news and trends, pay attention to trading volume, and practice reading and interpreting various chart patterns.
Q: How can I predict cryptocurrency prices using graphs?
A: Predicting cryptocurrency prices using graphs involves analyzing chart patterns, trends, and technical indicators. While it's not possible to predict prices with certainty, identifying trends (upward, downward, or sideways) and using indicators like RSI or MACD can provide insights into potential future movements.
Q: What are crypto charts and why are they important for traders?
A: Crypto charts are visual representations of the price movements and trading volumes of cryptocurrencies over time. They are essential for traders as they provide valuable insights into market trends, historical performance, and potential future behavior, aiding in informed decision-making.
Q: What are the different types of charts used in crypto trading?
A: The different types of charts used in crypto trading include line charts, bar charts, and candlestick charts. Line charts show the closing prices over a set period, bar charts display opening, closing, high, and low prices, and candlestick charts offer detailed information on price movements within a specific timeframe, making them particularly popular among traders.
The information on this website is for general information only. It should not be taken as constituting professional advice from FameEX.