A Comprehensive Novice Guide: How to Read Crypto Charts for Futures Trading
2023-06-20 11:31:40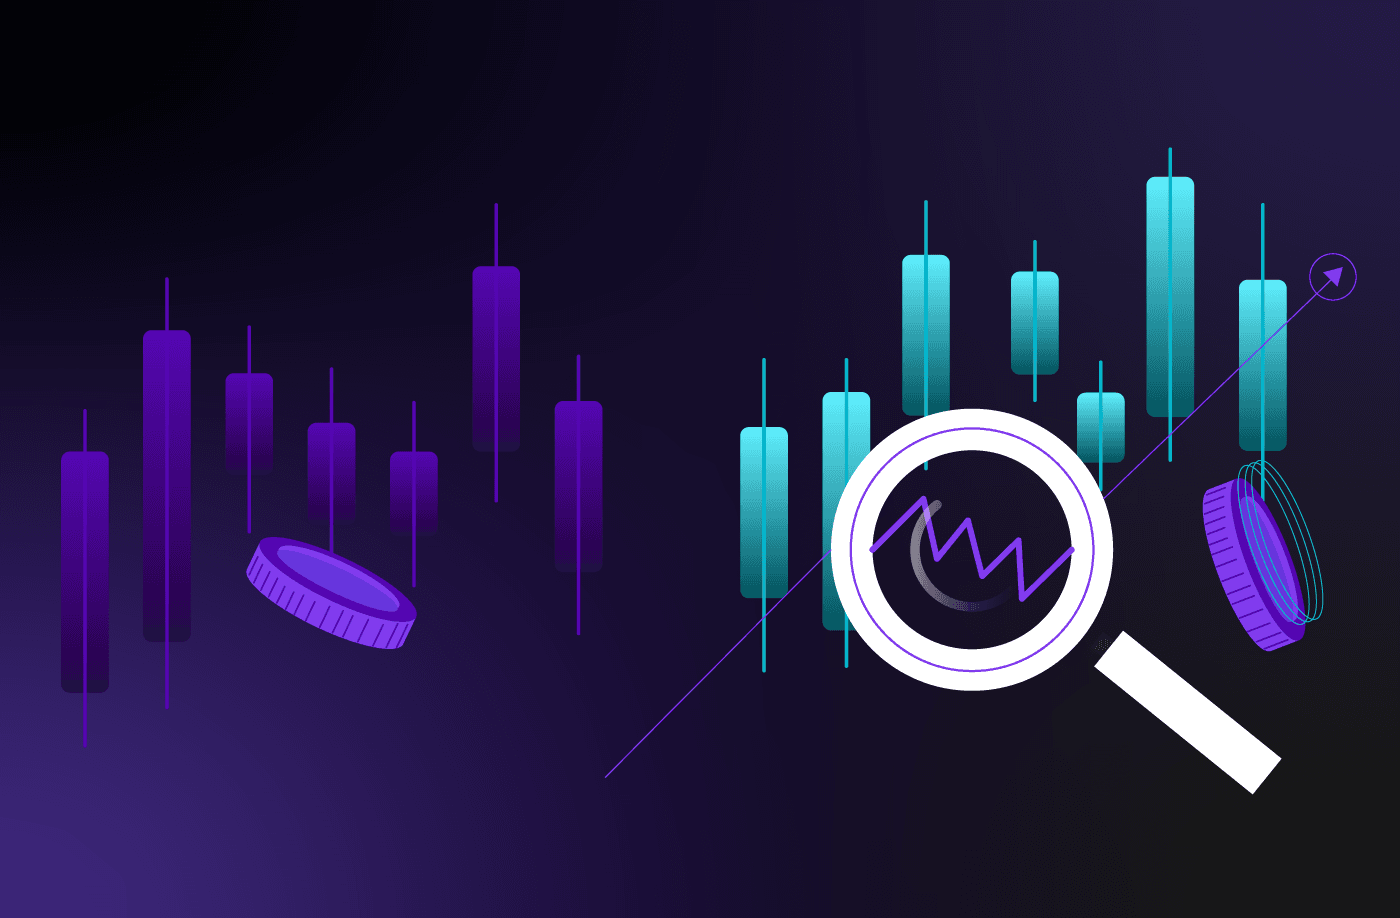
Cryptocurrency futures trading can be a lucrative yet complex endeavor, especially for beginners. Understanding how to read and analyze crypto futures charts is crucial for success in this volatile market. This blog post will break down the essential aspects of interpreting crypto futures charts for novice traders, providing them with the knowledge and tools needed to navigate this exciting but challenging landscape.
The Rise of Crypto Futures Trading
In recent years, the cryptocurrency world has experienced significant evolution thanks to the introduction of futures trading. Crypto futures offer traders the opportunity to speculate on future price movements of digital assets, making it possible to profit in both bullish and bearish markets. This innovative financial instrument enables investors to hedge their risks and leverage their positions, elevating the sophistication of the crypto market. The increasing involvement of traditional financial institutions and retail traders in crypto futures has led to a surge in volume and liquidity, signaling a growing interest and confidence in this alternative asset class.
Why Understanding Charts is Crucial for Successful Crypto Trading
Charts in crypto futures trading serve as a roadmap for traders, offering a visual representation of historical price data and market behavior. By analyzing these charts, traders can identify patterns, trends, and potential opportunities for profitable trades.
Without a solid grasp of chart analysis, traders may struggle to interpret market dynamics and may miss out on lucrative trading opportunities. Therefore, understanding how to read and interpret crypto futures charts is essential for navigating the volatile crypto market effectively.
How Cryptocurrency Charts Provide Insights into Market Trends and Price Movements
Crypto futures charts provide a wealth of information regarding market trends and price movements. By studying these charts, traders can identify key support and resistance levels, track the volume of trades, and analyze the impact of various technical indicators.
Moreover, charts can help traders anticipate potential price movements based on historical data, allowing them to formulate effective trading strategies and manage risk more efficiently. By keeping a close eye on chart patterns and trends, traders can stay ahead of market fluctuations and make well-informed trading decisions.

Setting Up Your Crypto Futures Trading Chart: Step-by-Step for Beginners
- Choose Your Platform: Select a reliable trading platform that offers advanced charting tools.
- Pick Your Time Frame: Decide on a time frame that suits your trading strategy (short-term or long-term).
- Customize with Indicators: Add relevant technical indicators like moving averages, RSI, and MACD to analyze price movements.
- Adjust Appearance: Fine-tune the color scheme and layout for better visibility and clarity.
- Explore Chart Types: Familiarize yourself with different chart options like line charts, candlestick charts, and bar charts.
- Essential Components: Ensure your chart includes price action, volume bars, and any necessary technical indicators.
- Experiment and Practice: Try different chart settings to find the configuration that works best for you.
Remember, mastering chart navigation takes practice. Don't be discouraged if it feels overwhelming at first. Next, we will explain the key components of cryptocurrency futures charts.
Understanding the Basics of Crypto Futures Charts
Price Chart: Opening and Closing Prices
The price chart is one of the most fundamental components of crypto trading charts. It provides information on the opening and closing prices, which are crucial for understanding daily price movements. The opening price is the price of the crypto asset at the beginning of a trading session, while the closing price is its price at the end of the session. Analyzing these metrics helps traders gauge whether to buy or sell a cryptocurrency based on its daily performance.
Trading Volume: What It Tells About Market Activity
Trading volume is a key indicator of market activity and liquidity. It represents the total number of units of a cryptocurrency traded within a specific period. High trading volumes signify a high level of interest in the crypto asset, making it easier to buy and sell without significantly impacting its price. On the other hand, low trading volumes can indicate limited interest and higher volatility, making it essential for traders to consider this metric when making trading decisions.
Candlestick Charts: Interpreting Wick, Body, and Shadows
Candlestick charts are popular tools for visualizing crypto price movements. Each "candlestick" on the chart includes a body and wicks (or shadows). The body represents the opening and closing prices, while the wicks indicate the high and low prices during the trading period. By interpreting the length and position of the wicks and bodies, traders can glean insights into market sentiment and potential future price trends.
Understanding Basic Terminology: Volume, Open Interest, and Price Action
- Volume: In crypto futures trading, volume plays a crucial role in confirming price trends. High volume during an uptrend suggests bullish momentum, while high volume during a downtrend indicates bearish pressure.
- Open Interest: Traders monitor open interest to assess the level of market interest in a particular cryptocurrency futures contract. Changes in open interest can signal potential trend reversals or continuations.
- Price Action: Analyzing price action involves studying the patterns and movements of a cryptocurrency's price on the chart. Traders use price action to identify key levels of support and resistance, as well as potential entry and exit points.
By understanding these essential components of crypto charts, along with basic terminology, new traders can gain a solid foundation for navigating the exciting world of crypto futures trading.
Interpreting Candlestick Patterns: Crypto Chart Patterns
Candlestick patterns are visual representations of price movements in the crypto futures market. Each candle displays the opening, closing, high, and low prices within a specific time frame. Understanding these patterns can provide valuable insights into market sentiment and potential future price movements.
Common Patterns and Market Sentiment
Traders often encounter candlestick patterns such as doji, hammer, and engulfing patterns when analyzing crypto candlestick charts. These patterns provide crucial insights into market sentiment and potential price movements. For instance, an inverted hammer candlestick indicates a potential reversal in a downtrend, suggesting that buyers may be stepping in after a price decline. Conversely, a Doji, which forms when the opening and closing prices are very close, suggests indecision in the market, where buyers and sellers are equally matched. This pattern often precedes a reversal or consolidation in price direction. By understanding these patterns and how they reflect the ongoing battle between buyers and sellers, traders can make informed decisions based on market dynamics.
Predicting Future Crypto Price Trends with Candlestick Patterns
The ability to interpret candlestick patterns accurately is a valuable skill for traders looking to predict future price trends. By recognizing patterns like bullish engulfing patterns (where a small bearish candle is followed by a larger bullish candle) or bearish wedges (where price action forms a pattern of lower highs and higher lows), traders can anticipate possible price movements and adjust their positions accordingly. Utilizing recognizable crypto charting methods, such as understanding candlestick patterns, can enhance their decision-making process and improve their overall trading performance.
Spotting Key Chart Patterns: Breakouts and Breakdowns
While candlestick patterns offer valuable insights, it's important to remember that different chart patterns have varying levels of reliability. Traders should assess the historical accuracy of each pattern to determine its effectiveness in predicting market trends. Additionally, successful interpretation often requires ongoing monitoring and analysis. Breakouts and breakdowns in chart patterns signify significant price movements. A breakout occurs when the price surpasses a certain level, indicating a potential upward trend. Conversely, a breakdown suggests a possible downtrend. Analyzing key data points within these patterns and understanding the implications of breakouts and breakdowns is crucial for traders to make informed decisions.
Identifying and Utilizing Support and Resistance Levels
Support and resistance levels are fundamental concepts in technical analysis, providing valuable insights for traders in the crypto futures market. Support levels represent price points where buying interest typically emerges, preventing the price from further decline. Conversely, resistance levels indicate price points where selling pressure intensifies, hindering the price's upward momentum. Understanding and identifying these levels on a crypto chart empowers traders to make informed trading decisions.
Historical Data: The Foundation of Support and Resistance
Historical price data serves as a cornerstone for determining support and resistance levels. By analyzing past market behavior, traders can identify significant price points where buyers (support) or sellers (resistance) have historically stepped in, influencing price movements. Studying these levels provides valuable insights into potential future price movements and areas where the trend may reverse.
Utilizing Support and Resistance for Strategic Trading
Support and resistance levels play a crucial role in developing effective trading strategies. Traders can utilize these levels to plan their entry and exit points, optimizing risk management and profitability. Buying near support with a stop-loss order placed just below the level can limit downside risk, while selling near resistance with a target profit level set slightly below can maximize gains. This strategic approach enables traders to capitalize on potential price reversals while minimizing potential losses.
Example: Utilizing Support and Resistance for Entry and Exit
Consider a scenario where the price of a cryptocurrency has been trending downwards and approaches a historical support level. If the price finds support at this level and starts to rebound, a trader might consider buying at or near this level, anticipating a potential trend reversal. Conversely, if the price approaches a resistance level and encounters selling pressure, a trader might consider selling at or near this level, expecting a potential trend continuation or reversal.
Identifying Trends: Moving Averages
Understanding moving averages can help you identify trends and potential entry or exit points in the crypto futures market. By analyzing the average price of an asset over a specific period, moving averages smooth out price fluctuations, making it easier to spot overarching trends. Two common types are the simple moving average (SMA) and the exponential moving average (EMA).
The SMA calculates the average closing prices over a set number of periods, providing a straightforward view of historical price movements. On the other hand, EMA gives more weight to recent prices, making it more responsive to current market conditions. By comparing different moving averages, such as the 50-day and 200-day SMAs or EMAs, you can gain insights into short-term and long-term trends simultaneously.
When the shorter-term moving average crosses above the longer-term one, it may signal a bullish trend forming. Conversely, if the shorter-term average crosses below the longer-term one, it could indicate a bearish trend. However, remember that moving averages are lagging indicators and should be used in conjunction with other analysis tools for confirmation before making trading decisions.
Incorporating Volume Analysis
Understanding Volume
Volume refers to the amount of a particular asset that is being traded over a specific period. In crypto futures trading, volume analysis can provide valuable insights into market dynamics. High volume often indicates strong interest and participation, suggesting potential price movements.
Volume Patterns
When analyzing volume, it's essential to look for patterns that can signal potential trend reversals or continuations. For example, a sudden spike in volume coupled with a price increase could indicate growing momentum and a possible uptrend. Conversely, decreasing volume amid price fluctuations might suggest a weakening trend.
Confirmation with Price Action
Combining volume analysis with price action can enhance your trading decisions. For instance, if you observe a breakout on high volume accompanied by a significant price movement, it can provide confirmation of the strength of the trend. Understanding how volume correlates with price movements is key to making well-informed trading choices.
Utilizing Oscillators and Technical Indicators for Effective Crypto Futures Trading
Technical analysis relies heavily on various tools to identify trends and potential trading opportunities. Oscillators and indicators play a significant role in this analysis, offering valuable insights for crypto futures traders. Here's a breakdown of their function and some commonly used examples:
1. Identifying Market Reversals and Overbought/Oversold Conditions
Oscillators help traders gauge momentum and potential turning points in the market. They often display these conditions through numerical values or visual representations within a specific range (e.g., 0-100).
Example: Relative Strength Index (RSI):
- Measures the magnitude of recent price movements.
- High RSI values (typically above 70) indicate overbought conditions, suggesting a potential price pullback.
- Conversely, low RSI values (typically below 30) suggest oversold conditions, potentially hinting at a buying opportunity.
2. Spotting Changes in Momentum
Indicators like moving averages can highlight shifts in momentum, allowing traders to identify potential trend continuations or reversals.
Example: Moving Average Convergence Divergence (MACD):
- Compares two moving averages of a cryptocurrency's price.
- A bullish crossover occurs when the shorter-term moving average (MACD line) crosses above the longer-term moving average (signal line), potentially indicating a strengthening uptrend.
- Conversely, a bearish crossover happens when the MACD line falls below the signal line, suggesting a weakening uptrend or a potential downtrend.
Key Takeaway: Combining Analysis for Informed Decisions
Remember, no single indicator or oscillator is a foolproof predictor. Always consider these points:
- Utilize multiple tools: Combine oscillators, indicators, and other technical analysis methods for a more comprehensive understanding of market trends.
- Confirm signals: Don't rely solely on one indicator's signal. Look for confirmation from other technical factors or chart patterns.
By effectively utilizing oscillators and indicators within your crypto futures trading strategy, you can gain valuable insights into market dynamics, improve your timing for potential trades, and ultimately enhance your overall trading experience.
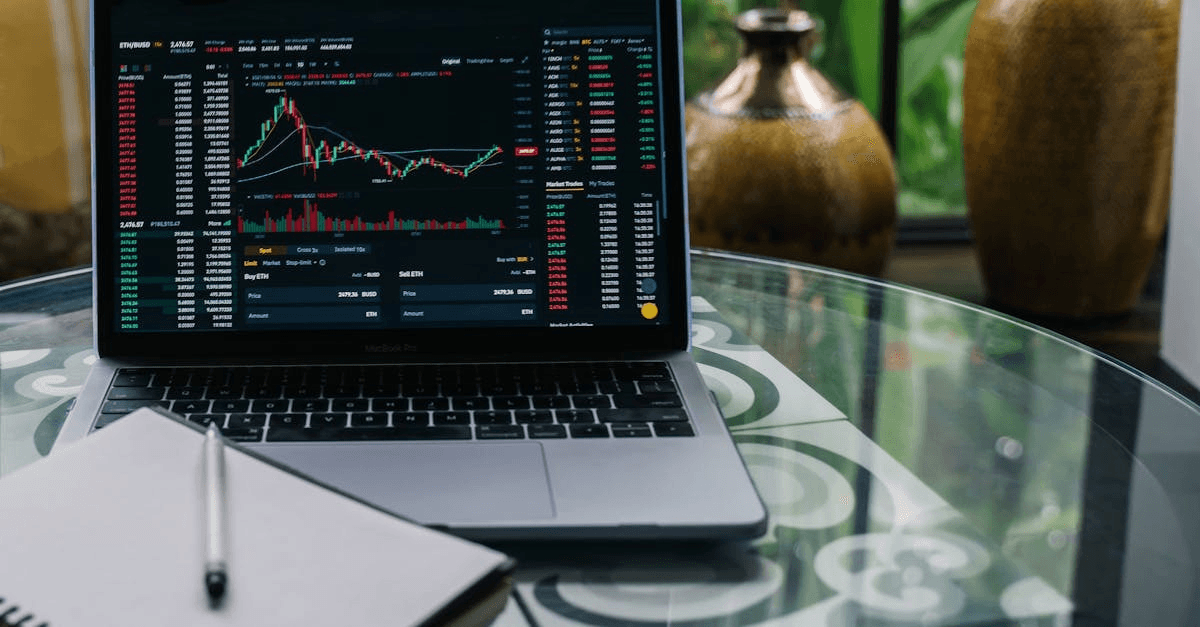
Applying Chart Analysis for Trading
Technical Analysis Tools
Traders utilize tradingview charts to apply technical analysis tools like RSI, MACD, and Fibonacci retracement levels. These tools help identify potential entry and exit points in the market.
Developing a Trading Strategy
By analyzing crypto charting patterns, trends, and key support/resistance levels, traders can develop a robust trading strategy. Understanding these aspects enables traders to make informed decisions based on market movements.
Risk Management Techniques
Implementing risk management techniques is crucial for successful trading. Traders can mitigate risks by setting stop-loss orders to limit potential losses and employing effective position sizing strategies. This ensures that traders protect their capital while maximizing profit potential.
Common Mistakes to Avoid in Reading Crypto Charts
When delving into the world of crypto futures trading, it's essential for beginners to be aware of common mistakes that can hinder their success. Understanding how to interpret charts accurately is crucial for making informed decisions and maximizing profits. In this final section, we will explore two key pitfalls to avoid when analyzing charts.
Overtrading based on misleading chart signals
One of the most prevalent mistakes novice traders make is overtrading based on misleading chart signals. It's easy to fall into the trap of reacting impulsively to every fluctuation in the market, especially when inexperienced. However, not every blip on a chart signifies a lucrative opportunity.
Without a solid understanding of technical indicators and chart patterns, traders may misinterpret signals and execute trades hastily. This can lead to unnecessary losses and hinder long-term profitability. It's crucial to exercise patience and discipline, relying on a comprehensive analysis rather than reacting emotionally to every movement.
Ignoring risk management principles when interpreting charts
Another critical mistake to avoid is neglecting risk management principles when interpreting charts. While it's essential to identify potential entry and exit points based on chart analysis, it's equally important to consider the associated risks.
Failure to implement proper risk management strategies, such as setting stop-loss orders and calculating position sizes based on account size and risk tolerance, can expose traders to significant losses. Risk management should be an integral part of every trading decision, ensuring that potential losses are controlled and capital is preserved.
By avoiding these common mistakes and approaching chart analysis with a strategic mindset, beginner traders can enhance their trading skills and navigate the crypto futures market more effectively.
Conclusion
In conclusion, understanding how to read crypto futures charts is a fundamental skill for anyone looking to succeed in the world of cryptocurrency trading. By following the insights and tips provided in this guide, beginners can navigate the complexities of chart analysis with confidence and enhance their trading strategies. Empower yourself with the knowledge of chart reading and embark on your journey to becoming a successful crypto futures trader.
Frequently Asked Questions About how to read crypto futures chart
Q: Why should a trader learn how to read cryptocurrency charts?
A: Understanding how to read cryptocurrency charts is essential as it allows traders to make informed decisions by analyzing trading signals, identifying market trends, and predicting future price movements. This knowledge helps in finding the best opportunities and minimizes risks.
Q: What are the features of a crypto chart that traders use?
A: Crypto charts can help investors with several features such as candlestick patterns, moving averages, volume indicators, and support and resistance levels. These features help in interpreting trading activity and making predictions about future price actions.
Q: What are the best crypto chart indicators?
A: The best crypto chart indicators include Relative Strength Index (RSI), Moving Averages (MA), Bollinger Bands, MACD (Moving Average Convergence Divergence), and Volume Indicators. These tools assist crypto traders in understanding market conditions and spotting trading opportunities.
Q: How do you identify a bearish crypto chart?
A: A bearish crypto chart typically shows downward trending price movements, higher selling volumes, and the presence of bearish indicators such as the falling moving averages and bearish candlestick patterns. Reading a crypto chart with these signals can help in recognizing a decline in the market.
Q: What is the best crypto charting software available?
A: The best crypto charting software includes platforms like TradingView, Coinigy, FameEX and CryptoCompare. These tools offer advanced charting features, real-time data, and a variety of crypto chart indicators that aid in comprehensive technical analysis and crypto trading.
Q: How do crypto charts help in technical analysis and crypto futures trading?
A: Crypto charts provide visual representations of price data over time, enabling traders to use technical analysis to interpret past and current trading activity. This analysis helps in predicting future price movements and making strategic trades.
Q: What are the common mistakes traders should avoid when reading cryptocurrency future charts?
A: Common mistakes include neglecting volume analysis, relying solely on one type of indicator, not considering different time frames, ignoring news and market sentiment, and overtrading based on false signals. It's crucial for a crypto trader to avoid these pitfalls to ensure effective trading decisions.
Q: How can traders use crypto charts to identify the best trading opportunities?
A: Traders can use crypto charts to identify best trading opportunities by analyzing patterns, determining support and resistance levels, and using indicators like RSI and MACD to gauge market momentum and potential reversal points. This helps in executing well-timed trades.
Q: Why is using the best crypto futures charting software important for traders?
A: Using the best crypto charting software provides access to reliable data, multiple chart types, customizable indicators, and live updates. These tools enable traders to conduct in-depth analysis and stay ahead of market trends, leading to better-informed trading decisions.
This is not investment advice. Please conduct your own research when investing in any project.