Beginner's Guide to Crypto Technical Analysis for New Investors and Best Trading Indicator
2024-02-06 09:16:55Cryptocurrency trading has gained immense popularity, and for new investors, understanding the nuances of technical analysis is crucial. This beginner's guide will delve into the key aspects of technical analysis in cryptocurrency trading, offering insights into the best trading indicators to optimize investment strategies.
What is the Technical Analysis in Cryptocurrency Trading?
Technical analysis in cryptocurrency trading is a methodology that uses historical market data, primarily price and volume, to forecast future price directions. This technique is based on the premise that all available information about an asset is reflected in its current value, thereby integrating market psychology into its approach. It operates under the belief in the cyclical nature of history and the market's assimilation of information.
In the particularly volatile cryptocurrency market, where prices fluctuate rapidly, technical analysis serves as a vital tool for traders. It combines statistical analysis with behavioral economics, focusing on chart patterns, mathematical indicators, and trend formations to predict future price movements. This approach hinges on the concept that the past trading activities and price changes of a cryptocurrency are indicative of its potential future price trends. Technical analysis is not exclusive to cryptocurrencies and applies to any asset with a history of trading data, including stocks, futures, commodities, and currencies.
The Basic Concept of Technical Analysis
Technical analysis is grounded in the belief that all current market information is already reflected in the price of each cryptocurrency. Therefore, studying price action is all that is required to make informed trading decisions. This form of analysis operates on three core principles: market action discounts everything, prices move in trends, and history tends to repeat itself. Technical analysts use various tools like charts, trend lines, support and resistance levels, and numerous indicators like Moving Averages, Bollinger Bands, MACD (Moving Average Convergence Divergence), and others to identify patterns and predict future movements.
Roles of Technical Analysis in Crypto Trading
Technical analysis plays several pivotal roles in cryptocurrency trading. Before beginning to trade, beginners should understand the following key factors in the analysis:
- Identifying Trends: It helps in spotting both short-term and long-term trends in crypto prices.
- Timing Trades: By predicting potential future movements, it aids in deciding when to buy or sell a particular cryptocurrency.
- Risk Management: By recognizing trend reversals and market shifts, it helps in mitigating risks and protecting investments.
- Trading Psychology: Technical analysis also aids in understanding the mass psychology of the market, providing insights into how other traders might react.
How Does Technical Analysis Work in the Crypto Market?
Cryptocurrency trading involves predicting price fluctuations by interpreting and analyzing cryptocurrency charts. As a trader in this volatile market, mastering this technical analysis skill is crucial. Rapid price changes in the cryptocurrency market necessitate precise analysis and forecasting.
Cryptocurrency charts present visual data on price, volume, and other key indicators. These charts vary in time frames, such as daily, weekly, or monthly, and employ diverse technical indicators to aid in deciphering market trends. Skillfully reading and analyzing these charts enhances your understanding of market behaviors and potential trends. Understanding Cryptocurrency Market Trends:
- Upward Trend
- Downtrend
- Consolidation situation
Recognizing these trends is pivotal for deciding the optimal times to enter or exit the market, thus avoiding trades during unfavorable periods.Moreover, technical indicators, mathematical or statistical tools based on price and volume data, are prevalent in cryptocurrency trading. These indicators quantify market trends and forecast price changes, offering signals and alerts to support informed trading decisions.
By mastering the art of reading and analyzing cryptocurrency charts, you gain deeper insights into market behavior, enabling you to predict price movements and make well-informed trading decisions. For instance, the RSI (Relative Strength Index) is a momentum oscillator that measures the speed and change of price movements, helping identify overbought or oversold conditions. Chart patterns like 'head and shoulders', 'triangles', or 'flags' give indications of the market's future direction. Candlestick patterns, another crucial aspect of technical analysis, provide insight into market sentiment and potential reversals in the market. These tools, when combined, help traders make educated guesses about where a cryptocurrency's price is headed next.
Limitations of Technical Analysis for Crypto Traders
Despite its usefulness, technical analysis is not without its shortcomings, especially in the crypto sphere:
- Unpredictability: Cryptocurrencies are known for their unpredictability and can be affected by factors outside the scope of technical analysis.
- Historical Data Limitation: Some cryptocurrencies have limited historical data, which can make pattern identification and analysis challenging.
- Market Manipulation: In smaller or less liquid markets, price manipulation can render technical analysis less effective.
Due to the limitations of technical analysis, it's beneficial to blend it with more comprehensive approaches like fundamental analysis and market trend analysis. This method enables you to delve deeper into cryptocurrency charts, offering a more thorough understanding of market behaviors. It assists in predicting price movements, thereby allowing you to make well-informed trading decisions.
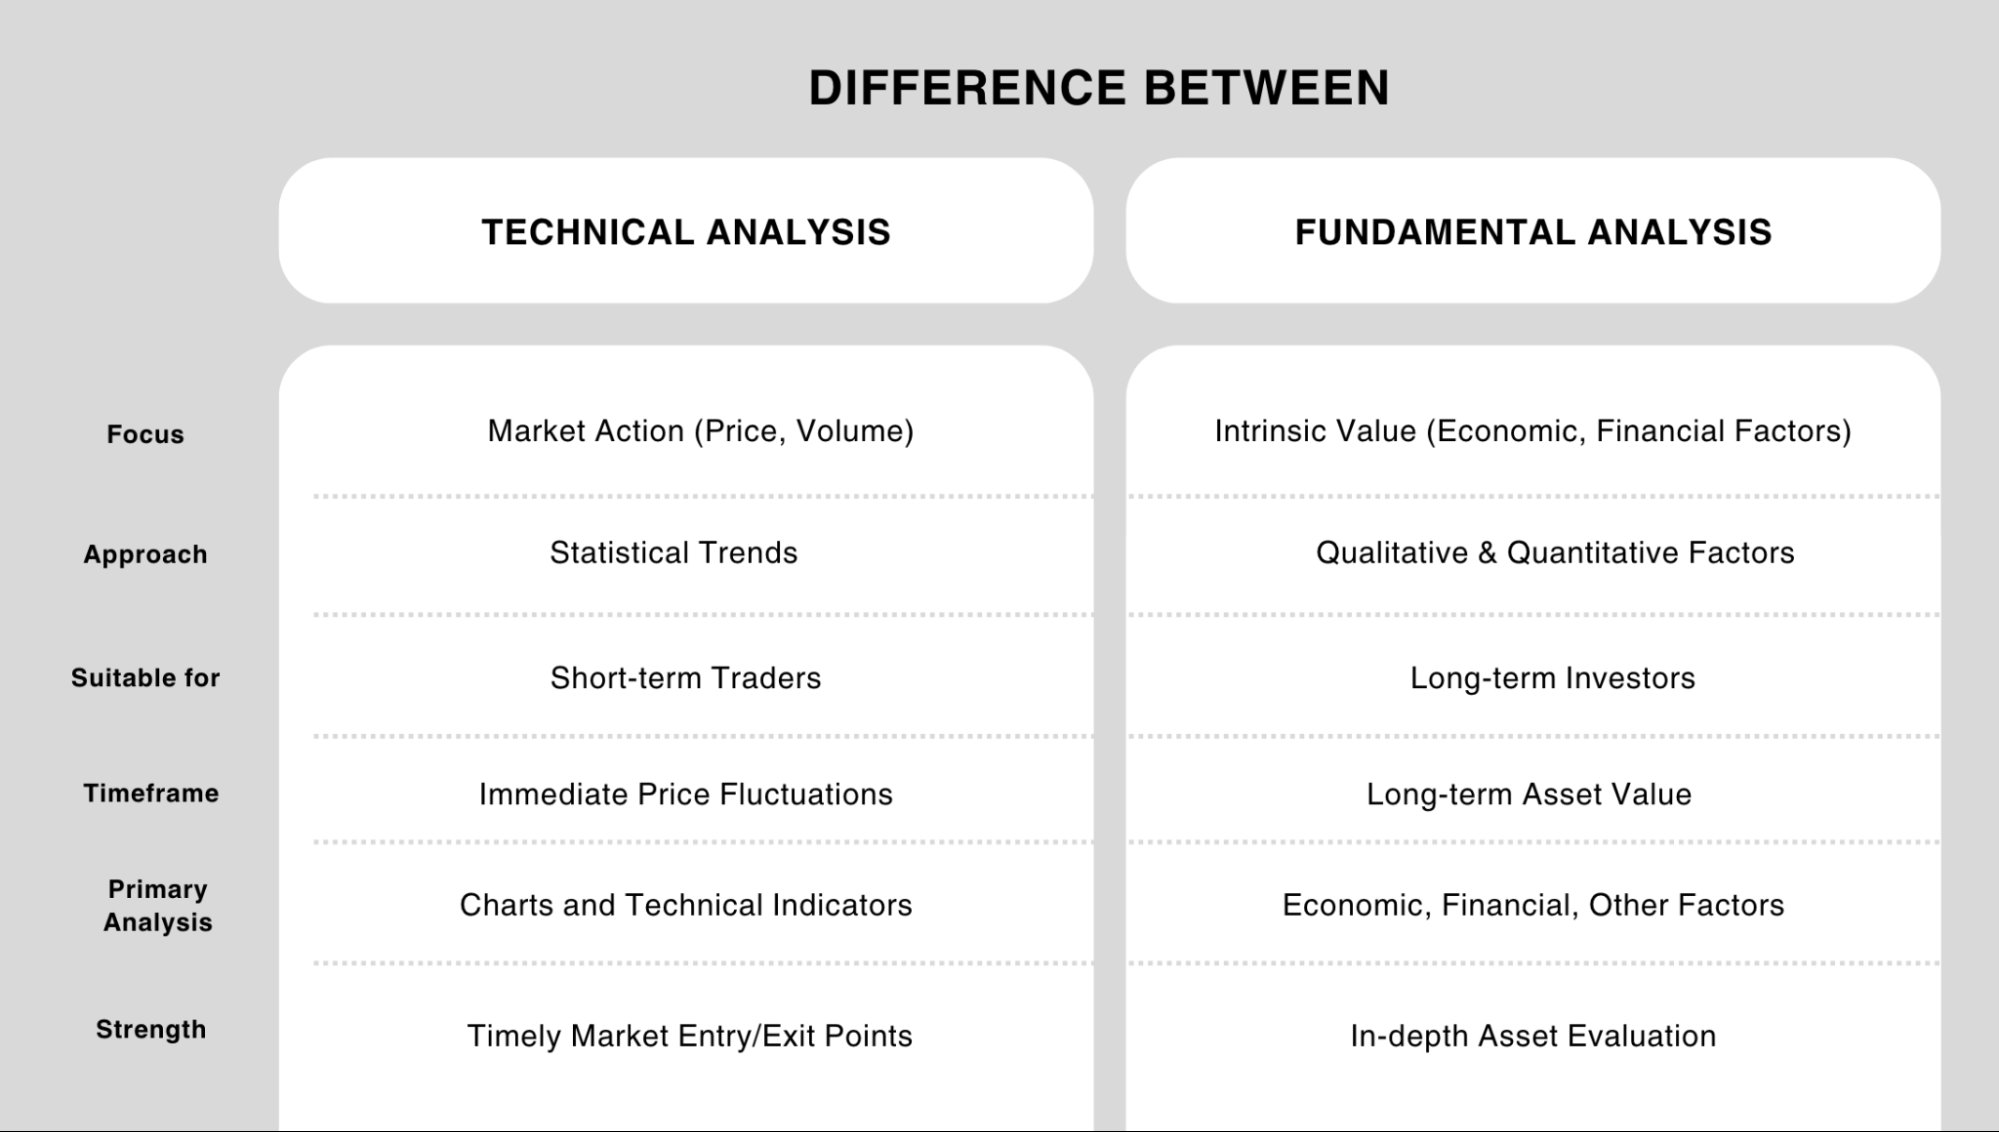
Comparing Technical Analysis and Fundamental Analysis
While technical analysis is focused on the study of market action primarily through the use of charts and technical indicators, fundamental analysis takes a different approach. In crypto trading, selecting the correct approach or strategy that aligns with your needs is crucial. Investors have the option to focus on technical analysis, which involves examining statistical trends from market activity like price movements and volumes. Alternatively, fundamental analysis, which assesses the intrinsic value of a currency through economic, financial, and other qualitative and quantitative factors, may be more suitable for those with a longer-term perspective.
- Short-term traders: If you prefer fast-paced trading and focus on immediate price fluctuations, technical analysis might be more suitable.
- Long-term investors: If you're more concerned with the long-term value of an asset and are willing to invest time in studying its fundamentals, then fundamental analysis could be a better fit.
- Combining Both Approaches: Some investors integrate both technical and fundamental analysis to gain a comprehensive market overview, leveraging the strengths of each method.
The biggest contrast between these two methods is their approach; while fundamental analysis looks at the "what" and "why" behind price movements, technical analysis looks at the "when" and "how". Combining both methods can provide a more rounded approach to cryptocurrency investing and trading.
Technical Indicators: Helping Hand for New Crypto Investors
Technical indicators serve as critical tools for investors especially those new to the space. These indicators provide quantifiable data derived from market statistics, such as price and volume, aiding in the prediction of future market trends.
Understanding Technical Indicators in Crypto Trading
Technical indicators in crypto trading are algorithms or calculations based on the price, volume, or open interest of a cryptocurrency. Technical analysis involves traders using a range of indicators and methods to discern market trends, primarily through charts and the historical movement of prices. These indicators are used to forecast financial or economic trends and to provide insights into potential future price movements. This approach is particularly relevant in cryptocurrency trading due to the market's volatility.
A fundamental tool in this analysis is the Simple Moving Average (SMA), which averages the closing prices of a cryptocurrency over a selected time frame, providing a smoothed price trend. A variation of SMA is the Exponential Moving Average (EMA), which places greater emphasis on recent closing prices. This makes the EMA more responsive to price changes, a useful feature in the fast-moving cryptocurrency market.
The Relative Strength Index (RSI) is another vital indicator, known as an oscillator. Unlike SMAs that track price changes over time, oscillators like RSI use mathematical formulas to generate values within a specific range (0 to 100 for RSI), offering insights into potential overbought or oversold conditions.
Bollinger Bands (BB) are also popular in crypto trading. This indicator consists of two bands that fluctuate around a moving average, signaling potential market volatility and identifying overbought or oversold conditions.
More advanced indicators, such as the Stochastic RSI and Moving Average Convergence Divergence (MACD), build upon these basic tools. For instance, MACD involves subtracting one EMA from another, aiding in identifying trend reversals and momentum in cryptocurrency prices.
Trading Signals in Cryptocurrency
These technical indicators are crucial for spotting general trends and specific trading signals, like optimal entry and exit points. In cryptocurrency trading, where market conditions can shift rapidly, these signals are invaluable. For example, an RSI reading above 70 might indicate an overbought market, suggesting a potential sell signal, whereas a reading below 30 could signify an oversold market, indicating a buy opportunity.
Each type of indicator serves a specific purpose and offers unique insights. For example, trend indicators like Moving Averages help identify the direction of the market, while momentum indicators like the Relative Strength Index (RSI) help detect the strength of a trend and potential reversal points. It's essential to recognize that while technical indicators are powerful tools in cryptocurrency trading, they are not foolproof. The market's inherent volatility can lead to false signals, making it crucial for traders to use these tools judiciously and in conjunction with other analysis methods.
How to Use Technical Indicators for Trading Decisions?
Using technical indicators for trading decisions involves understanding what each indicator represents and how it can be applied to your trading strategy.
For instance, a moving average crossover can signal a potential change in trend, which might suggest an entry or exit point for a trader. The RSI, when it moves into overbought or oversold territory, can indicate a potential reversal in the current trend. It's crucial to use these indicators in combination rather than in isolation, as each indicator can provide different information. A common approach is to use one indicator for identifying a potential trend and another to confirm it. Moreover, understanding the time frame you are trading in is essential, as the same indicator can provide different signals in different time frames.
Choosing the Good Technical Indicators for Crypto Traders
Selecting the right technical indicators depends largely on a trader's style and the market conditions. For long-term investors, trend-following indicators like the Moving Average or MACD might be more beneficial, as they help in identifying sustainable trends. For day traders or those looking for short-term opportunities, momentum indicators like the Stochastic Oscillator or the RSI could be more useful, as they can provide quick insights into market dynamics. It's also important to consider the market's volatility; in highly volatile markets, using indicators that adjust for volatility, like Bollinger Bands, can be advantageous. Personal comfort with the indicator also plays a crucial role; a trader should understand how an indicator works and feel confident in interpreting its signals. Experimenting with different indicators and backtesting them on historical data can help traders find the combination that works best for their trading strategy.
Deep Diving into Crypto Technical Analysis Tools and Indicators
While technical indicators are essential, understanding the specific tools and methodologies of technical analysis in cryptocurrency trading offers a more detailed approach. This segment delves into the practical applications and nuances of various technical analysis tools beyond the realm of basic indicators, providing a more comprehensive understanding for traders.
Significance of Moving Averages in Crypto Trading
Moving averages are fundamental tools in crypto trading, serving as the backbone of many technical analysis strategies. They smooth out price data to create a single flowing line, which makes it easier to identify the direction of the trend. Simple Moving Average (SMA) and Exponential Moving Average (EMA) are the two most common types. SMAs provide a straightforward average of prices over a specified period, while EMAs give more weight to recent prices, making them more responsive to new information. By using moving averages, traders can identify key support and resistance levels, trend directions, and potential reversal points in the market.
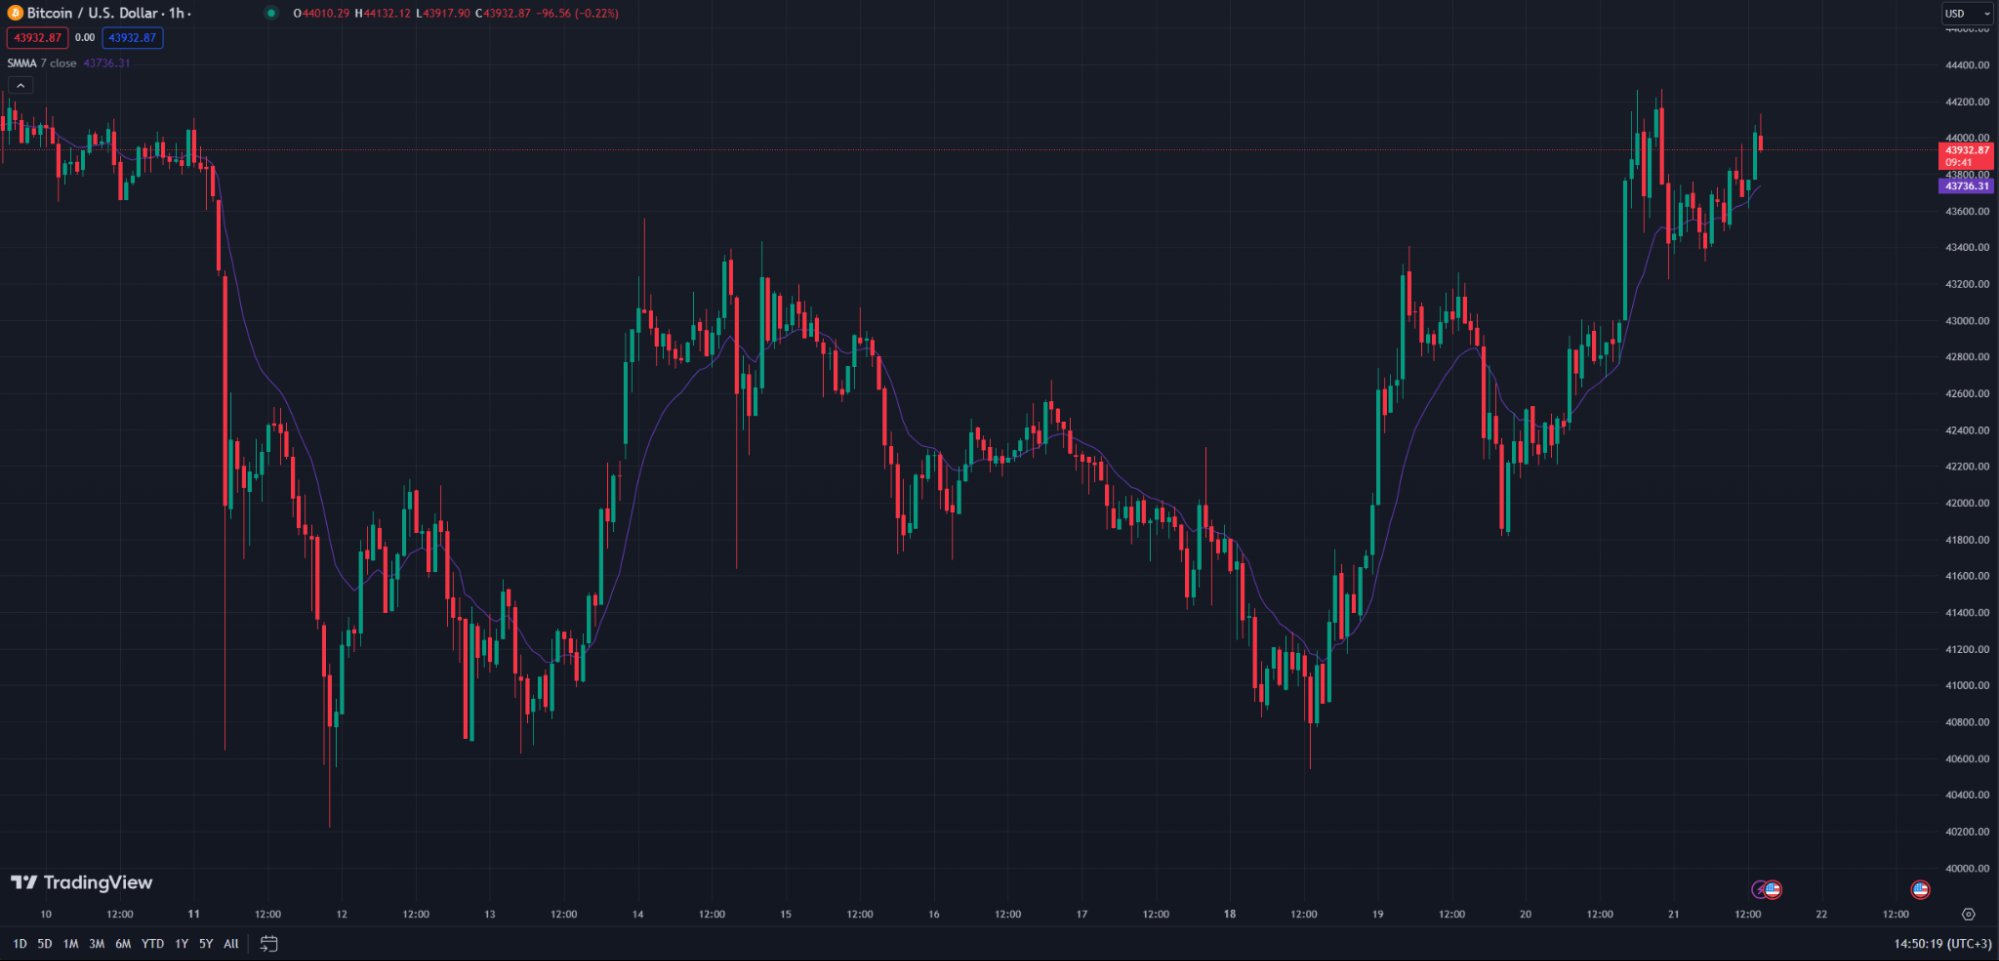
SMA indicator from TradingView
Configuring the Relative Strength Index (RSI) in Crypto Technical Analysis
The Relative Strength Index (RSI) is a momentum oscillator that measures the speed and change of price movements. In crypto technical analysis, it is primarily used to identify overbought or oversold conditions, which can signal potential reversals. The RSI is plotted on a scale of 0 to 100, with readings above 70 indicating overbought conditions and readings below 30 suggesting oversold conditions. Traders can configure the RSI period, with a 14-day period being the most common. Adjusting this period can increase sensitivity for short-term trading or decrease it for long-term trend analysis.
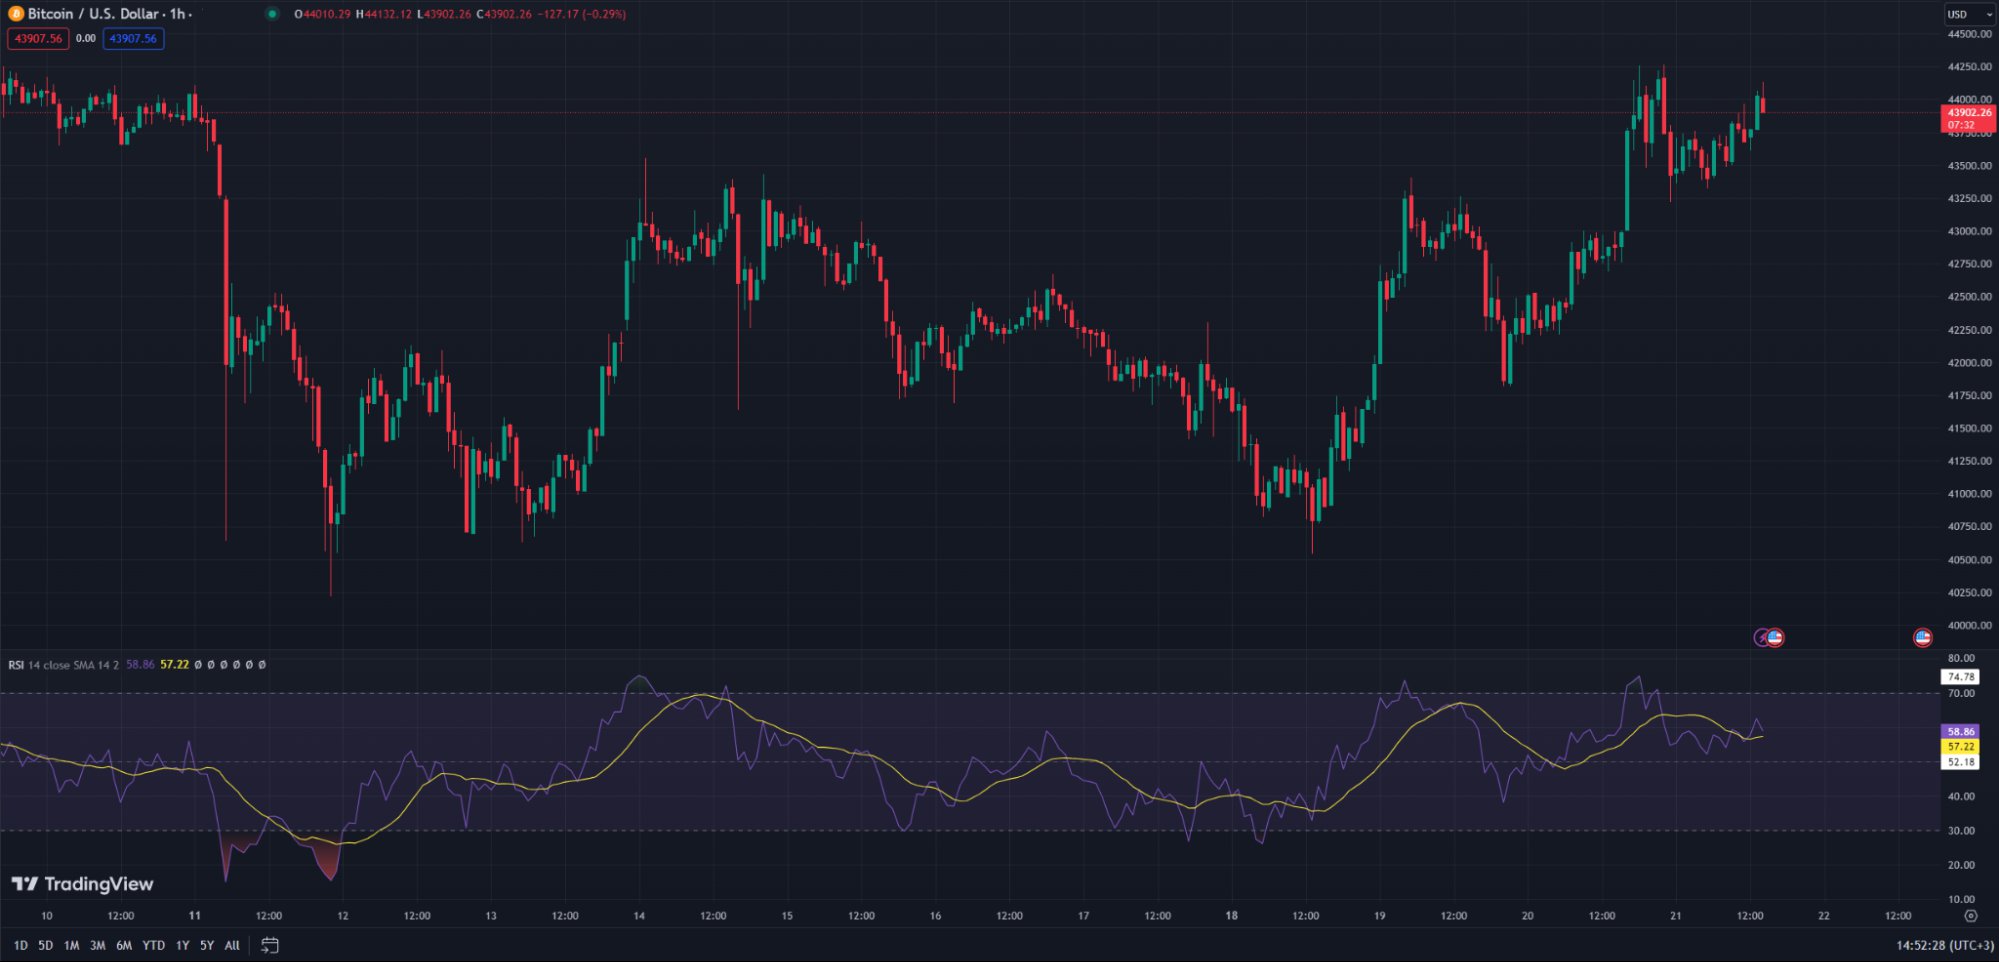
RSI indicator from TradingView
Using Trend Lines in Your Crypto Trading Strategy
Trend lines are straight lines drawn on a chart that connect a series of price points. They are pivotal in identifying the direction of a trend and potential reversal areas. In a bullish market, an upward trend line is drawn by connecting the lowest lows of the price movement. Conversely, in a bearish market, a downward trend line connects the highest highs. These lines not only help in predicting future movements but also in identifying breakout points when the price moves beyond the trend line, indicating a potential shift in the trend.
Trendline, source: Wikipedia
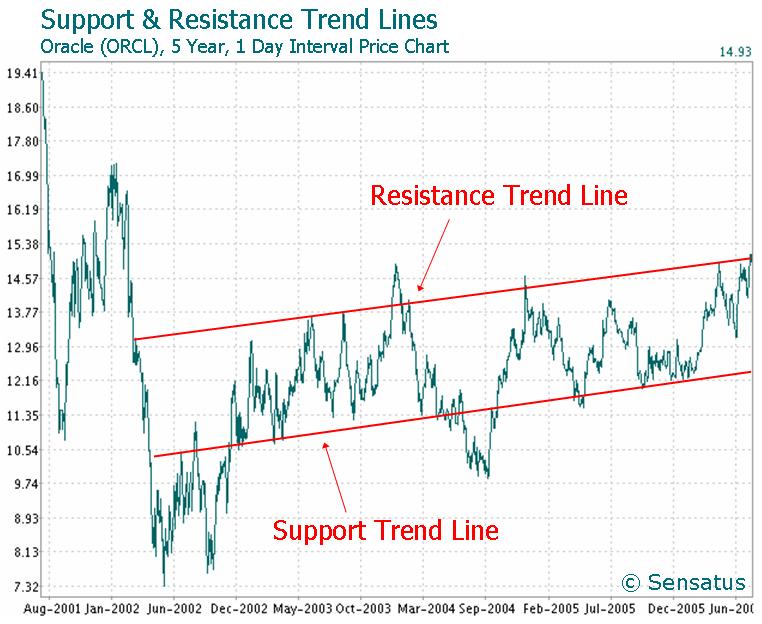
Role of Support and Resistance Levels in Technical Analysis
Support and resistance levels are key concepts in technical analysis, offering traders valuable insights into the price behavior of a cryptocurrency. A support level is where the price tends to find a floor and bounce back up, while a resistance level is where the price seems to hit a ceiling and falls back. These levels are identified by analyzing the historical price movements of an asset. Understanding these levels helps traders make informed decisions about entry and exit points, stop-loss orders, and potential breakout or breakdown points.
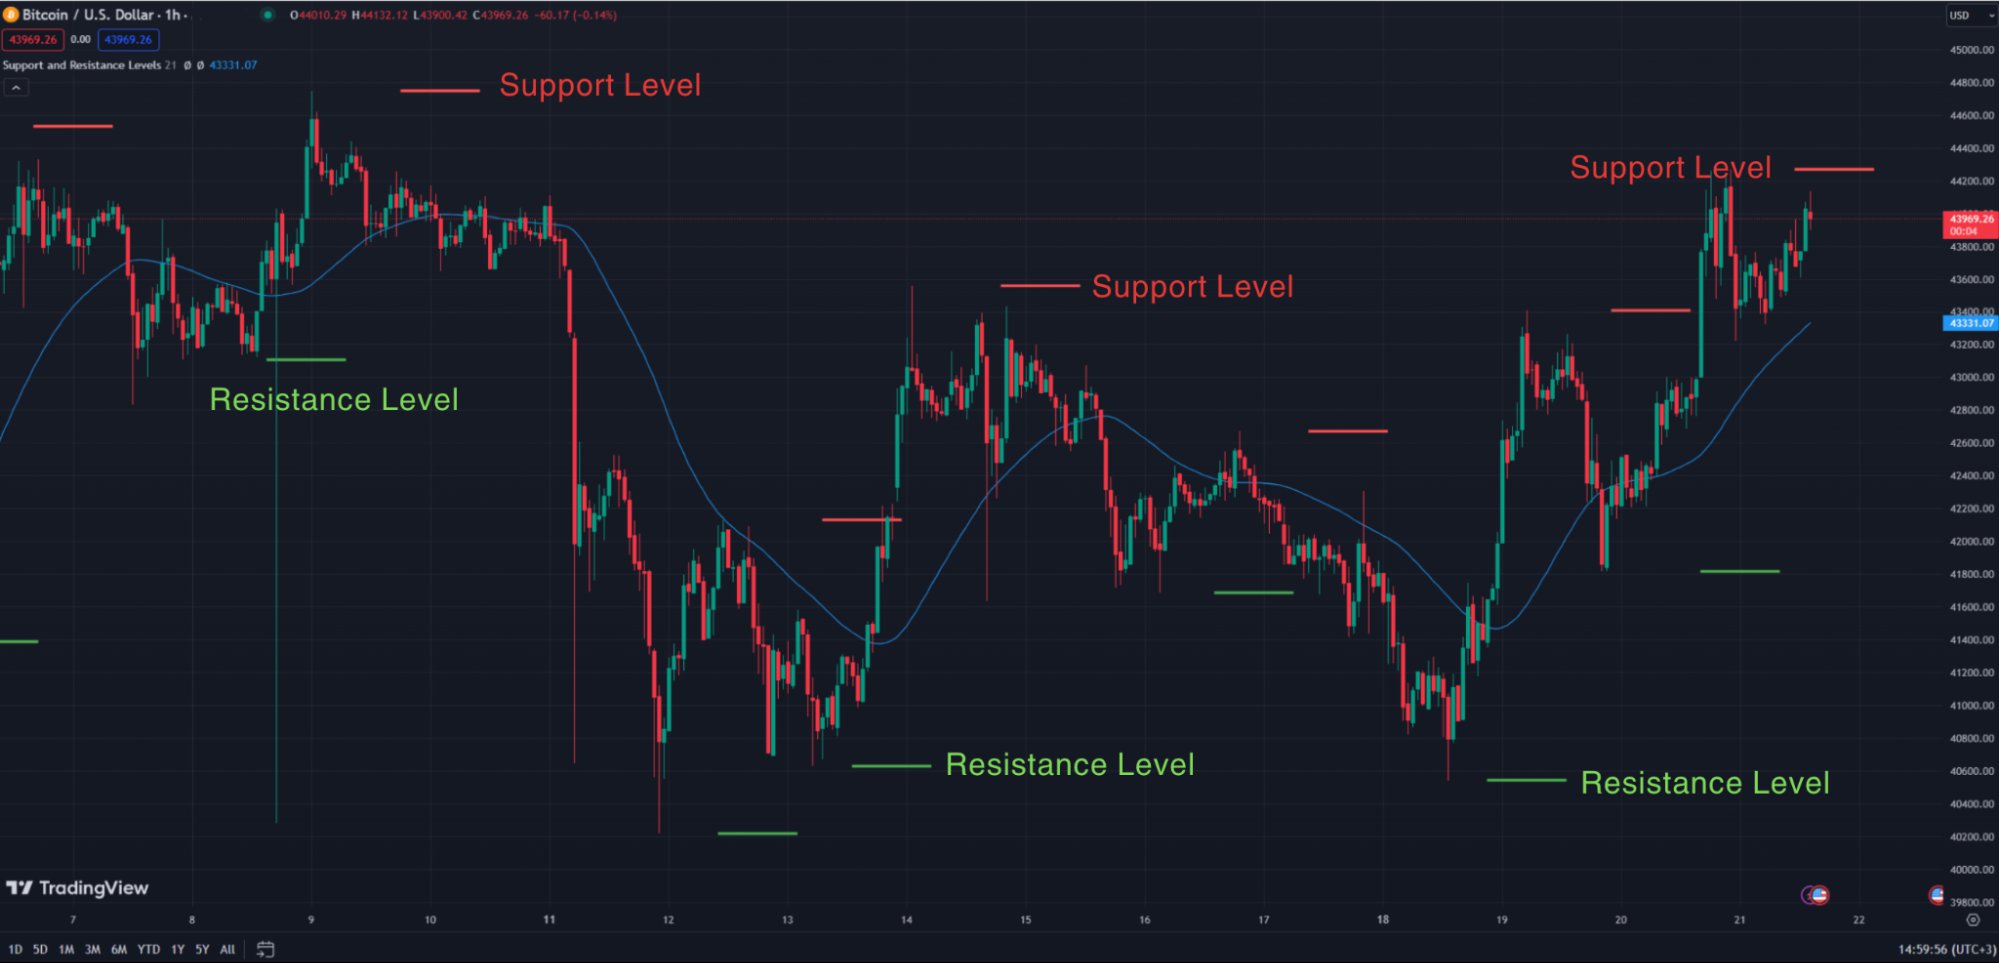
Support and Resistance Levels from TradingView
Navigating Trading Volume for Crypto Asset Prediction
Trading volume is a significant indicator of market activity and sentiment. In crypto technical analysis, it refers to the number of coins traded within a specific period. High trading volumes can indicate strong interest in the asset and can validate a trend. For instance, an upward price movement with high volume is generally seen as more robust and likely to continue than a similar movement with low volume. Conversely, a decrease in volume can signal a decrease in interest and potentially a reversal of the current trend.
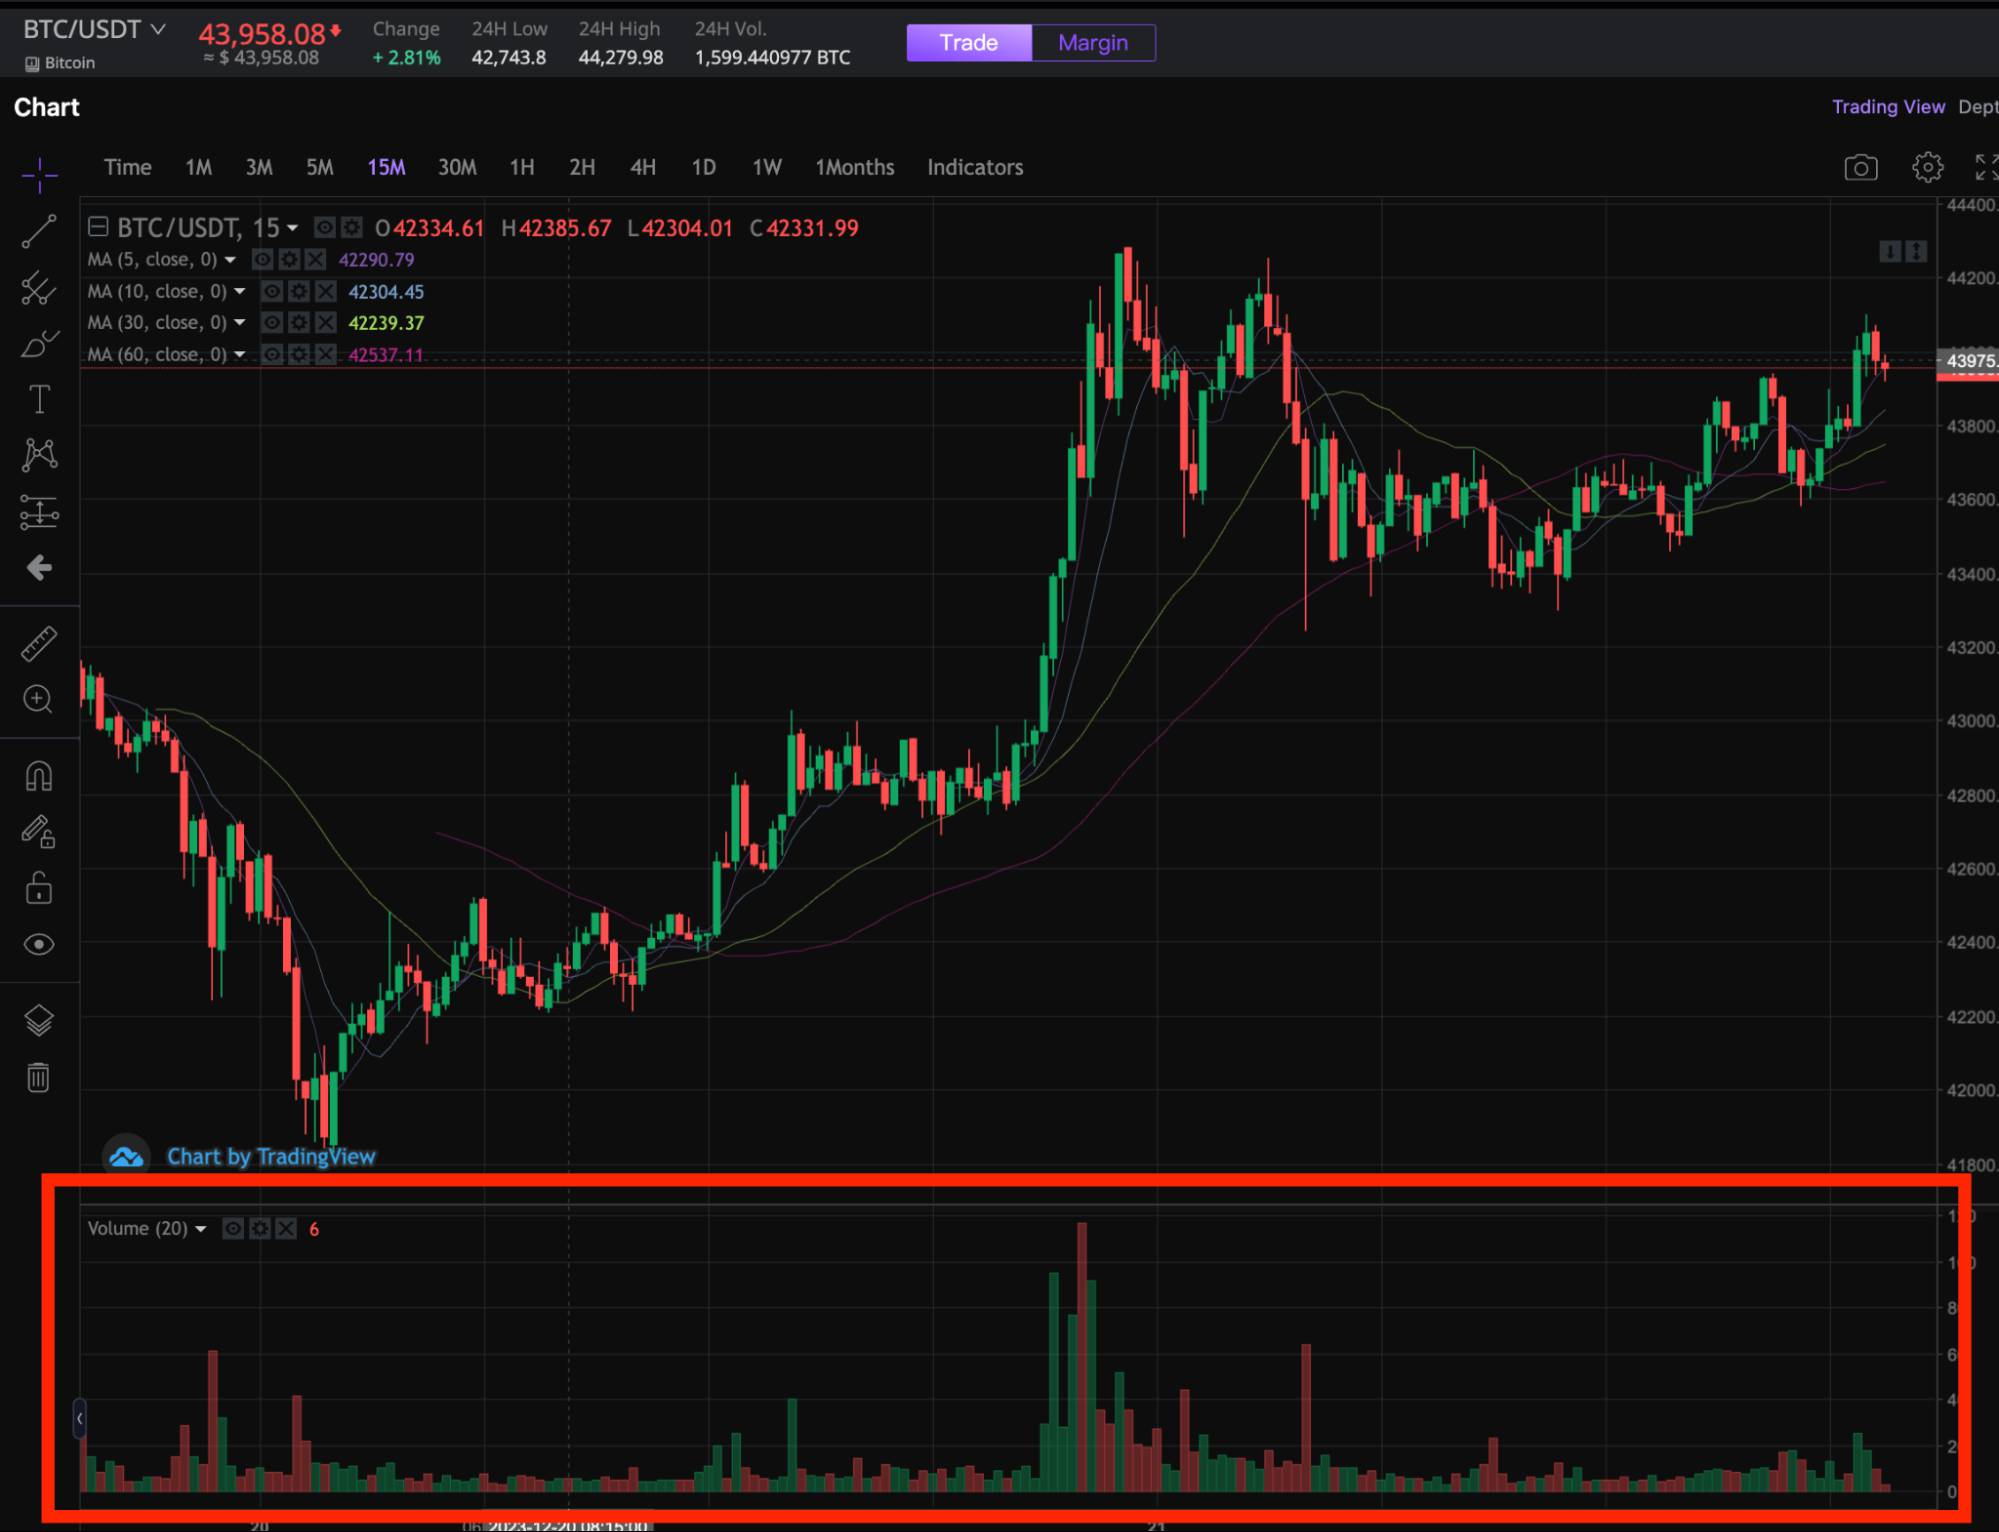
Trading volume for BTC/USDT from FameEX
Crypto Market: The Importance of Candlestick Chart in Technical Analysis
Candlestick charts are a crucial component of technical analysis in the crypto market. Each candlestick provides four key pieces of information: the opening price, the closing price, the highest price, and the lowest price over a specific period. These charts are popular because they provide a quick, detailed understanding of market movements. Patterns formed by candlesticks, such as 'doji', 'hammer', and 'engulfing', can indicate potential trend reversals or continuations. By analyzing these patterns, traders can glean insights into market sentiment and make more informed trading decisions.
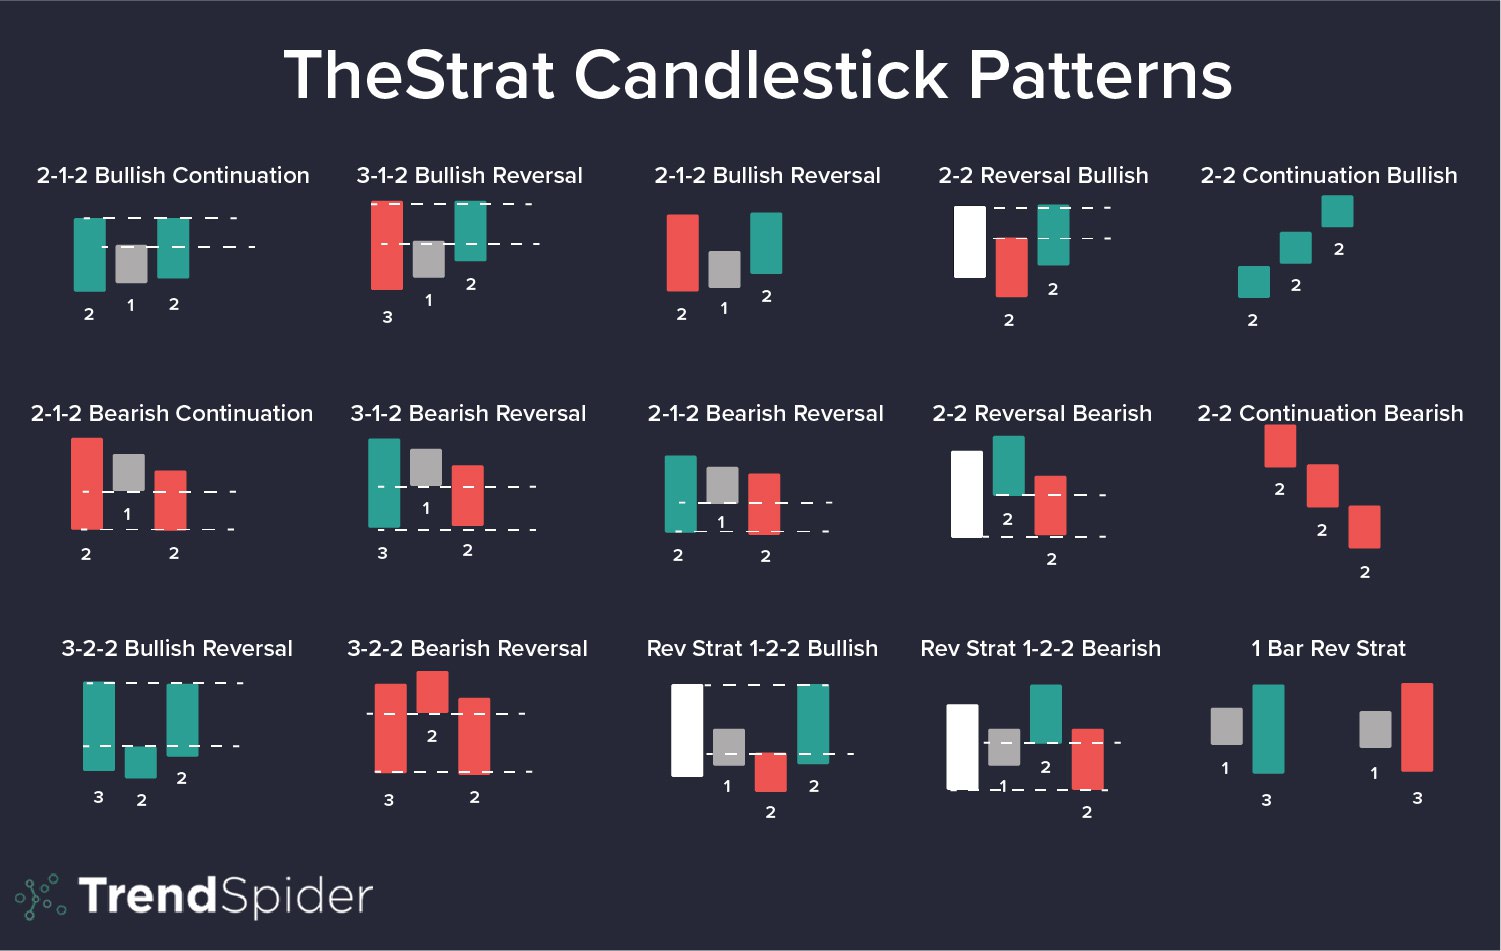
Different patterns for candlestick chart, Source
Crypto Technical Analysis for Beginners: 101 Guide
For those new to cryptocurrency trading, understanding technical analysis can be a daunting task. However, with our step-by-step approach, beginners can effectively navigate this complex field. We aim to equip new crypto traders with the essential knowledge and skills required to start their trading journey.
First Steps to Take for Crypto Trading Beginners
For beginners, we will ensure you learn how to perform technical analysis of cryptocurrencies step by step. To conduct technical analysis on a cryptocurrency, follow these steps:
1. Set Up a Practice Account:
Create a trading account on the FameEX platform and take advantage of the free trial funds offered during the sign-up event. This allows new beginners to practice freely without the risk of using real money.
2. Select a Cryptocurrency:
Pick a cryptocurrency for analysis and collect its historical price data, available on various cryptocurrency exchanges or price-tracking websites.
3. Choose a Time Frame:
Decide the period you wish to analyze, which can vary from short-term day trading to long-term investment strategies.
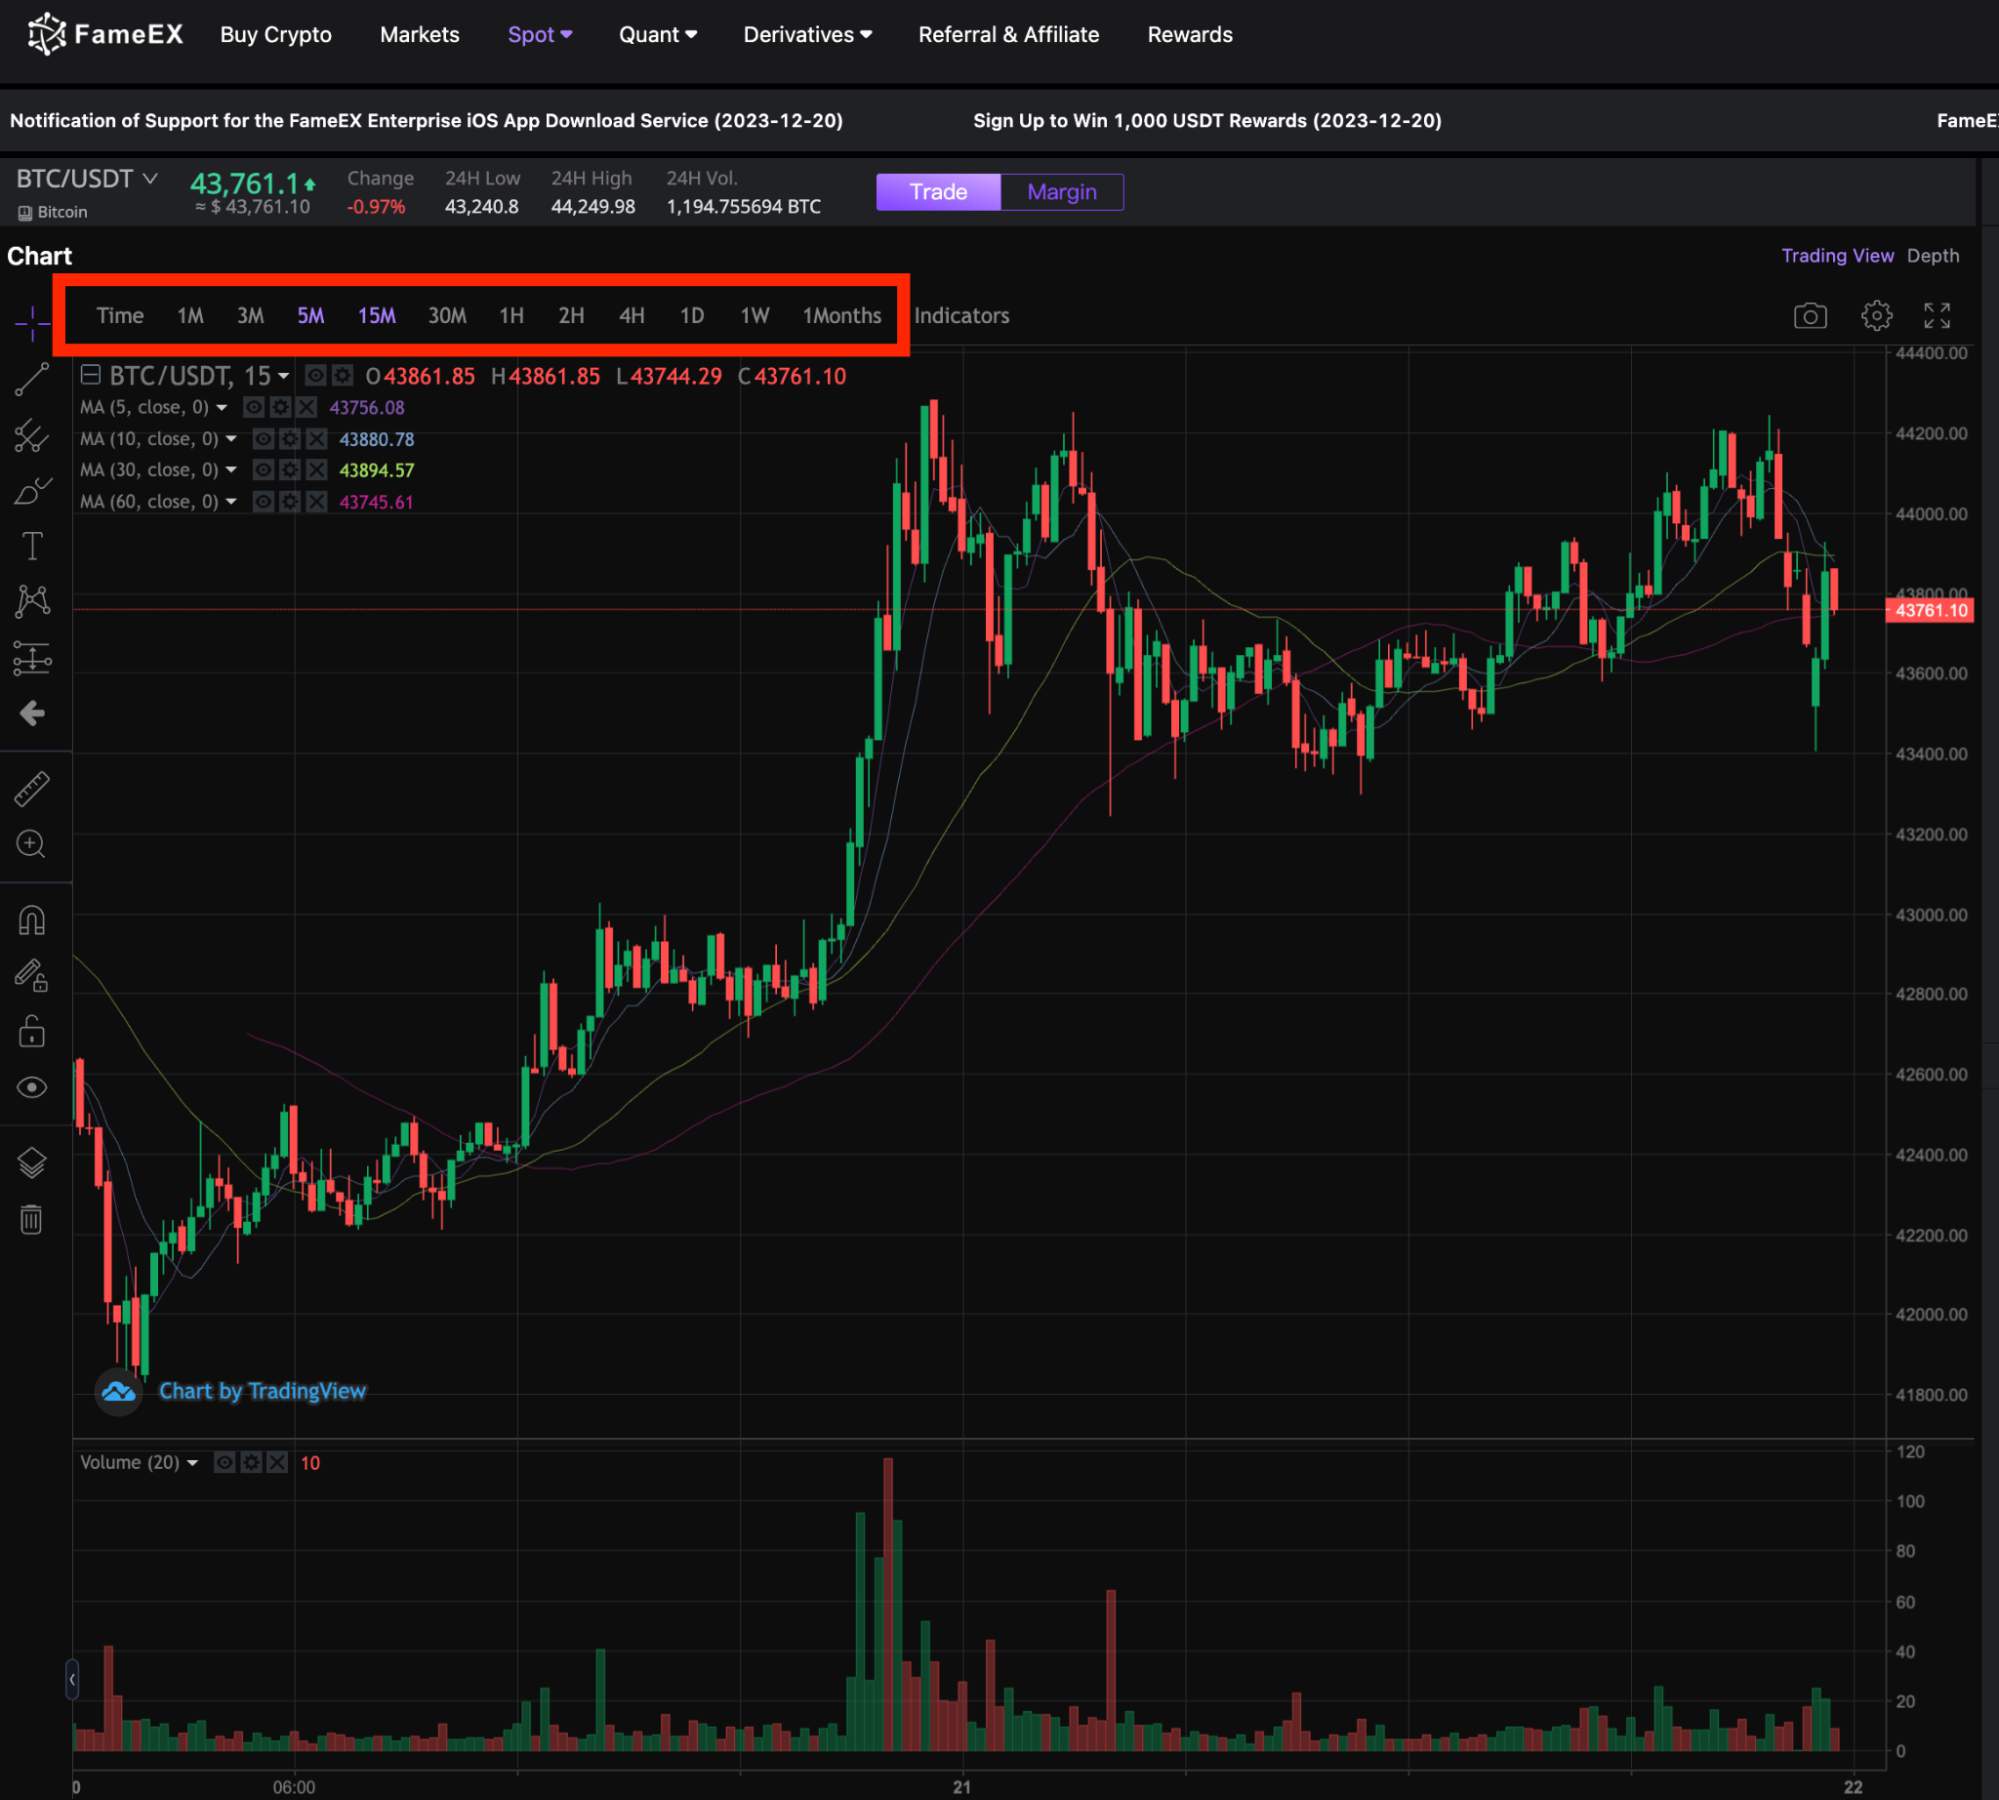
4. Apply Technical Indicators:
Implement technical indicators like moving averages, the Relative Strength Index (RSI), and Bollinger Bands on the chart for deeper insights into market trends and potential price shifts.
5. Examine Chart Patterns:
Search for familiar chart formations such as head and shoulders, double tops/bottoms, triangles, and wedges.
6. Determine Support and Resistance Levels:
Identify crucial support and resistance points by finding areas where the price has consistently encountered buying or selling pressure.
7. Decide on Trading Action:
Use your analysis to make a trading decision, whether it's to buy, sell, or hold the cryptocurrency for a longer duration.
8. Risk Management:
Understand and implement risk management strategies like setting stop-loss orders.
Decoding Price Chart: A Beginner's Must-Have Knowledge
Evaluating price charts is a key skill in crypto technical analysis especially for beginners. To start, it's important to learn how to read Candlestick Charts, where each candlestick represents the open, high, low, and close prices within a specific time frame. For more information about candlestick charts, you can read this guide here.
Additionally, understanding common patterns is crucial; this includes recognizing bullish and bearish trends, consolidation phases, and reversals. Practicing with different time frames, such as daily and hourly charts, is essential for grasping both short-term and long-term trends. Therefore, beginners should familiarize themselves with basic indicators and tools, starting with simple ones like Moving Averages and the Relative Strength Index (RSI), to better understand market trends and momentum.
Practical Tips for New Cryptocurrency Traders
If you're just starting to trade in cryptocurrencies, there are several tips you might want to consider before diving into this field:
- Start Small: Begin with a small amount of capital that you can afford to lose.
- Keep Emotions in Check: Avoid making decisions based on fear or greed.
- Diversify Your Portfolio: Don’t put all your funds into one cryptocurrency.
- Use Technical Analysis: Apply technical analysis tools to inform your trading decisions, but remember they are not foolproof.
Trading success doesn't happen overnight. Be patient and learn from your trades in the long-term game. Before starting your journey in cryptocurrency investing, it's crucial to conduct thorough research. Often, newcomers experience a fear of missing out and hastily put their money into investments without adequate consideration. Remember, this involves your own hard-earned money. Make sure you have financial stability through other reliable and regulated means first.
Identifying Trading Opportunities as a Beginner Trader
Identifying trading opportunities requires a combination of research, analysis, and intuition. For beginners:
- Trend Spotting: Look for established trends in the market, as riding a trend is often safer than betting against it. To spot these trends, consider monitoring discussions on platforms like Telegram, Twitter, or Reddit. Engaging with crypto communities and following influencers can provide insights and help spot emerging trends. This can help you identify topics that are receiving high attention.
- Technical Indicators & Volume Analysis: High trading volumes can indicate strong market interest and potential trading opportunities. Use indicators like MACD or Bollinger Bands to identify potential entry and exit points.
- News and Events: Stay updated on news that can affect cryptocurrency prices like regulatory changes, technological advancements, and economic events.
- Risk vs Reward: Evaluate the potential risk and reward of a trade. As a beginner, it's advisable to look for opportunities with a higher probability of success, even if it means smaller gains.
Behind the Scenes: Combining Technical and Fundamental Analysis for Crypto Trading
Relying on a single analysis method can be limiting but combining technical and fundamental analysis offers a more holistic view, enabling traders to make more informed decisions. This comprehensive approach leverages the strengths of both methods to enhance the effectiveness of crypto trading strategies.
Synergy of Technical and Fundamental Analysis in Crypto Trading
The synergy between technical and fundamental analysis in crypto trading lies in their complementary nature. Fundamental analysis provides a broad understanding of market conditions, including economic indicators, industry trends, and geopolitical factors that can impact the intrinsic value of cryptocurrencies. It helps in identifying long-term value and potential growth opportunities. On the other hand, technical analysis focuses on market sentiment, using price charts and volume data to identify potential entry and exit points based on market trends and patterns. By combining these approaches, traders can gain a comprehensive understanding of both the 'why' behind market movements (fundamental analysis) and the 'when' of making trades (technical analysis).
Why Crypto Traders Use Both Technical and Fundamental Analysis?
Traders use both technical and fundamental analysis to balance their understanding of market dynamics. Fundamental analysis is key for understanding the long-term potential and stability of a cryptocurrency, considering factors like technological advancements, team competency, market adoption, and regulatory environment. Technical analysis, in contrast, helps in capturing short-term trading opportunities by understanding market trends and trader psychology. Utilizing both methods allows traders to align their short-term trading strategies with the long-term potential of the cryptocurrency, leading to potentially more sustainable trading decisions.
When to Use Technical Analysis Over Fundamental Analysis?
Technical analysis proves to be particularly valuable in certain scenarios. It is highly effective for short-term trading, such as day trading or short-term speculation, where the focus is more on market sentiment and immediate price movements rather than long-term fundamentals. Additionally, in periods of high market volatility, technical analysis offers quicker insights into prevailing market trends and potential trend reversals. Moreover, technical tools excel in identifying specific entry and exit points in the market, an aspect that is especially crucial in a fast-moving market environment.
Trying to Forecast Crypto Prices: Technical Analysis, Fundamental Analysis or Both?
Combining technical and fundamental analysis offers a comprehensive approach to forecasting cryptocurrency prices. Technical analysis is adept at predicting short-term price movements and assessing market sentiment, making it particularly relevant for traders focused on swift market trends. On the other hand, fundamental analysis excels in evaluating long-term value and stability, beneficial for investors intending to hold cryptocurrencies for extended periods. By understanding the underlying strength and potential growth of an asset, fundamental analysis complements the short-term insights provided by technical analysis.
The choice between these methods largely depends on a trader's objectives, risk tolerance, and investment timeframe. A hybrid approach that integrates both techniques caters to diverse trading strategies, enabling traders to navigate short-term market fluctuations while aligning with long-term fundamentals and trends. However, mastering this combination requires significant expertise, as its effectiveness varies across different markets.
When discussing cryptocurrency price prediction, it's crucial to consider both Technical Analysis (TA) and Fundamental Analysis (FA) as complementary tools. For instance, in the case of TLM/USDT trading pair, a thorough TA would involve monitoring its progression through a sloping line, with a potential upward movement towards a target of $0.030. This analysis should include close observation of the ascending channel, with strategic placement of stops to mitigate risks if the price moves beyond expected boundaries.
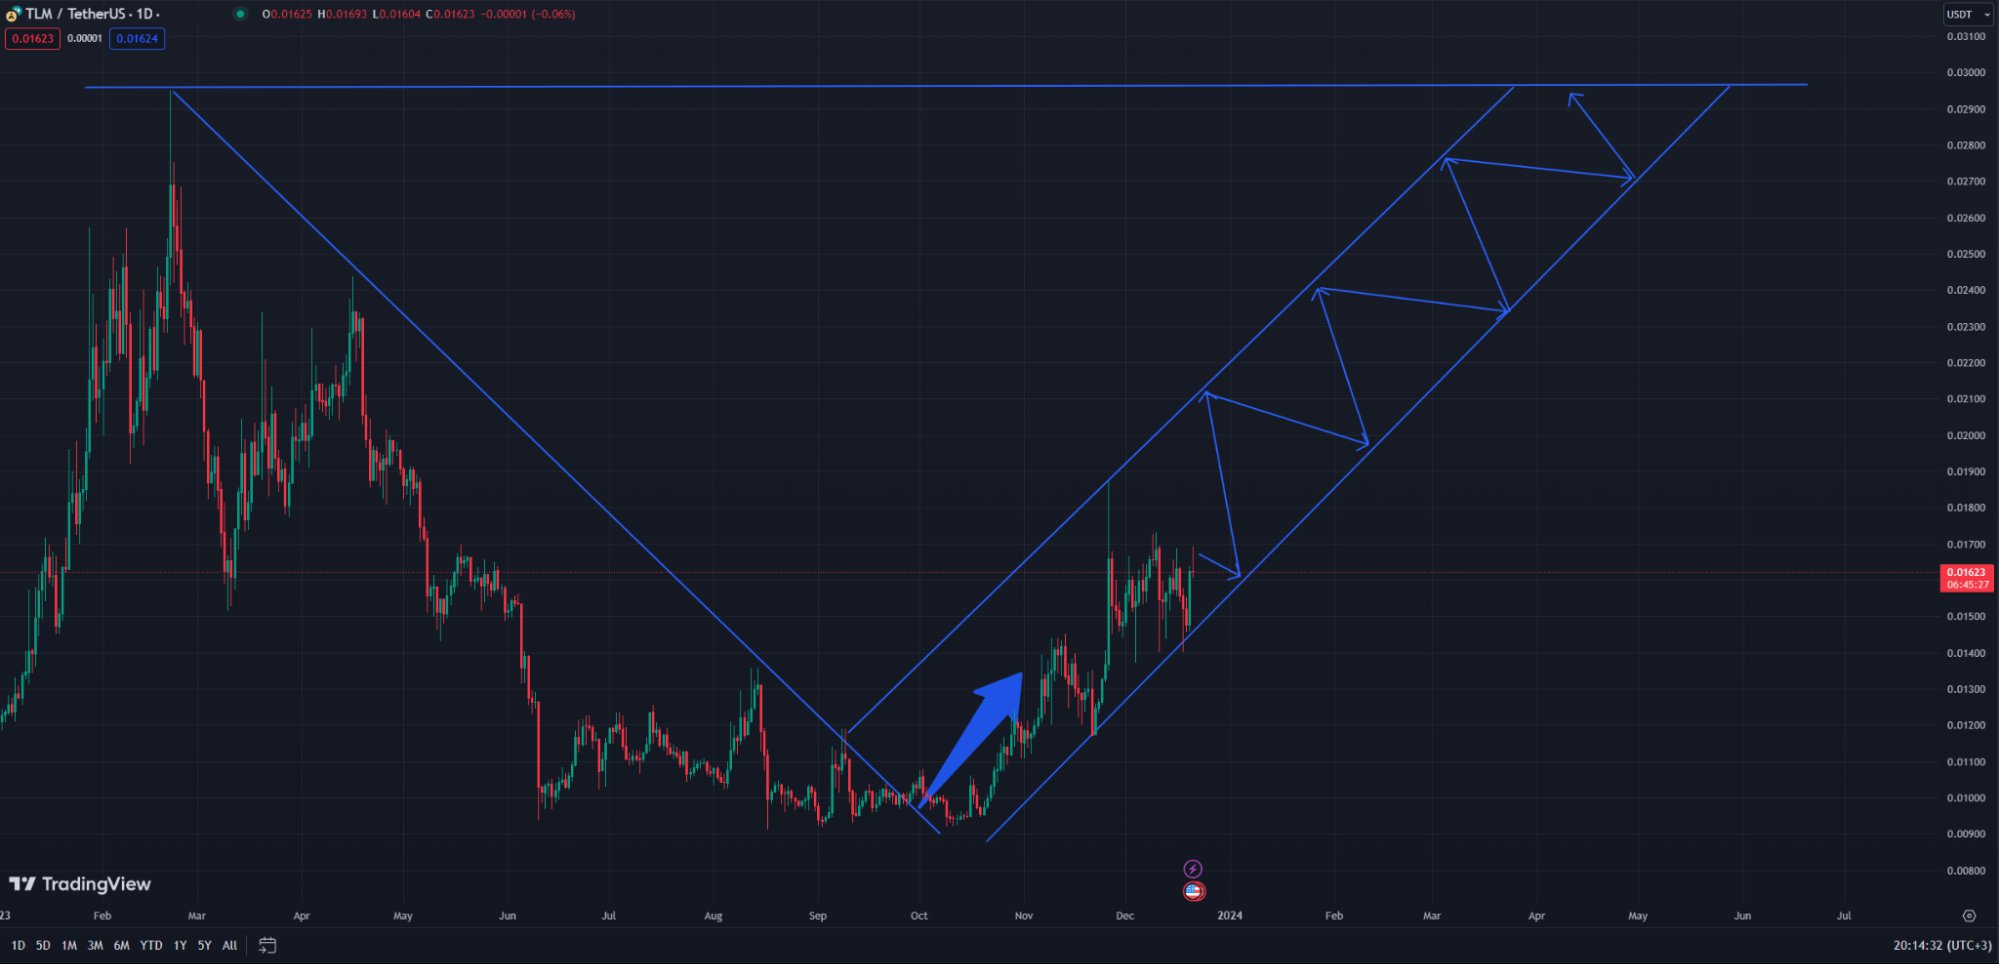
Trendline in TA chart, source: TradingView
Simultaneously, FA plays a significant role, especially considering that TLM is a token associated with the game Alien Worlds, which is gaining traction in the market. Fundamental factors like the game's increasing popularity, market position, and planned upgrades such as new planets, DAO improvements, and targeted marketing can significantly impact the token's value. These developments suggest a potential increase in user base and token value, underscoring the importance of integrating both TA and FA for a comprehensive understanding of TLM's future price trajectory. A balanced approach that leverages the insights from both TA and FA is essential for making informed predictions in the dynamic landscape of cryptocurrency markets.
For beginners in cryptocurrency trading, fundamental analysis is often more accessible due to its straightforward nature. In contrast, experienced traders frequently favor technical analysis. Fortunately, there are ample educational resources available for novices, offering guidance on how to effectively blend fundamental and technical analysis into successful trading strategies. This holistic approach not only broadens a trader's perspective but also enhances their ability to make informed decisions in the dynamic world of cryptocurrency trading.
Conclusion
The key to success in crypto trading lies in a balanced approach that incorporates both technical and fundamental analysis. Technical analysis excels in mapping market trends and timing trades, while fundamental analysis provides a deeper understanding of the underlying factors and long-term potential of cryptocurrencies. This dual approach enables traders to gain a comprehensive view of the market, aligning short-term trading tactics with long-term investment goals.
For beginners, it's essential to establish a solid foundation in both technical and fundamental analysis, and continuously adapt to the ever-evolving market conditions. Practical tools such as moving averages, RSI, and trend lines in technical analysis, combined with a keen awareness of industry news and developments in fundamental analysis, are invaluable for informed decision-making.
Critical to this journey is the practice of risk management. Balancing potential profits with associated risks, while maintaining patience and discipline, is crucial. Impulsive reactions to market fluctuations can lead to detrimental outcomes, hence the importance of a methodical and educated approach to trading. Ultimately, the fusion of technical and fundamental analysis, alongside a disciplined and well-informed strategy, positions traders for success in the dynamic and challenging world of cryptocurrency trading.
FAQ About Crypto Technical Analysis
Q: What are the best technical analysis indicators for cryptocurrency trading?
The best technical analysis indicators for cryptocurrency trading often include the Relative Strength Index (RSI), Moving Averages, the Moving Average Convergence Divergence (MACD), Bollinger Bands, and Fibonacci Retracement levels. These indicators help in identifying market trends, momentum, potential reversal points, and support/resistance levels.
Q: What is basic crypto technical analysis?
A: Basic crypto technical analysis involves studying the historical price and volume data of cryptocurrencies to predict future market movements. This includes analyzing price charts like candlestick charts, identifying trends, and using various technical indicators to gauge market sentiment and potential price movements. The core idea is that historical trading patterns and price behavior can offer insights into future trends.
Q: How do I start with technical analysis in cryptocurrency trading?
A: To start with technical analysis in cryptocurrency trading, begin by understanding the basic principles of market trends and price action. Learn to read and interpret price charts, such as candlestick charts. Familiarize yourself with key technical indicators like RSI, MACD, and Moving Averages. Practice with a demo account to apply these concepts in real-time without financial risk. Continuously educate yourself and stay updated with market trends.
Q: What are the best tools for crypto technical analysis?
A: The best tools for crypto technical analysis include charting software that offers a range of indicators and drawing tools. Platforms like TradingView, Tiger.Trade, or Messari provide comprehensive charting tools tailored for crypto markets. Additionally, tools that offer backtesting capabilities, real-time data feeds, and customizable indicators are highly beneficial for thorough analysis. Many traders also use mobile apps and news aggregators to stay informed about market conditions and news that can impact price movements.
The information on this website is for general information only. It should not be taken as constituting professional advice from FameEX.